
Page 20 - Mobility Management, August 2018
P. 20
CRT Trends: Big Data
What Clients Say About CRT
frequency — from zero falls to 5 or more falls — before clients received wheelchairs. Green follow-up numbers show how often clients fell after receiving their chairs. This chart shows that 47.8 percent of clients had no falls prior to receiving their wheelchairs. Once they had their wheelchairs, that “no falls” percentage rises to 75.84.
Chart 2 shows skin breakdown before (in blue) and after (in green) clients received their wheelchairs. The occurrence of skin breakdown shows a visible change.
Chart 3 shows how often clients left their homes in a week before (blue) and after (green) receiving wheelchairs.
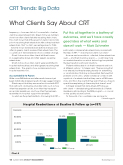
Chart 4 shows how often clients were readmitted to hospitals before (blue) and after (green) receiving their wheelchairs. The graphs show a visible reduction in hospital readmissions.
Accountability to Payors
While some FMA before-and-after results have not yet been statistically analyzed, results strongly suggest a trend.
Clients report that they are more functional with CRT than without it, and before-and-after data such as how often they experience falls, how often they’ve experi- enced skin breakdown, and how often they’ve been readmitted to hospitals support those beliefs.
So what are the potential effects of knowing that CRT —
Put this all together in a battery of outcomes, and we’ll have a really good idea of what works and doesn’t work — Mark Schmeler
particularly complex rehab wheelchairs provided with the help of ATPs — does improve client outcomes?
As more and more data is collected, future wheelchair users — and their insurance payors — could have more accurate information on which technology has yielded the best results in particular situations.
“Patients will be able to do their homework and look at different options,” Schmeler said. “They’re doing that now already, but they’re relying heavily on advertising
or on information that may not be vetted. We have that problem a lot in clinic, where somebody comes in with
a printout of a wheelchair that they saw in a CNN news story, and this is the one that they want. Then you have to spend time explaining to them why that doesn’t work.”
Schmeler added that data-driven ATP follow-up
with clients — already being performed by U.S. Rehab members participating in the FMA program — is crucial on the quality assurance front.
“In the world of accountable care and pay for
Continued on page 29
Hospital Readmittance at Baseline & Follow up (n=357)
100.00% 80.00% 60.00% 40.00% 20.00%
0.00%
80.67% 73.35%
17.17%
11.76%
9.48% Unsure
7.56%
Yes No Baseline Follow-up
Chart 4
18 AUGUST2018|MOBILITYMANAGEMENT
MobilityMgmt.com
