
Page 19 - Mobility Management, August 2018
P. 19
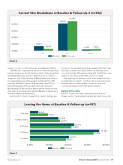
                                 Current Skin Breakdown at Baseline & Follow-Up 2 (n=356)
  80.00%
60.00%
40.00%
20.00% 14.06%
0.00%
5.88%
3.64% Unsure
5.04%
86.70% 82.30%
          Yes
No Follow-up
Baseline
  Chart 2
worker’s comp, vocational rehab and Veterans Affairs. The FMA also captured the 10 most commonly reported primary diagnoses of participating clients. They range from
Stroke/Cerebral Vascular Accident (the most common diagnosis, with 17.53 percent) to Other Neuromuscular or Congenital Disease (14.9 percent); Cerebral Palsy (9.91 percent); Multiple Sclerosis (9.74 percent); Spinal Cord Injury/Paraplegia (8.55 percent); Spinal Cord Injury/ Quadriplegia (5.93 percent); Osteoarthritis (4.49 percent); Amputation (3.64 percent); Morbid Obesity (3.39 percent); and Spina Bifida (2.88 percent).
Last month’s charts showed that clients say they are
more functional while using their wheelchairs than they are without them, and that clients say they are more successful when ATPs are involved with the CRT procure- ment process than when ATPs are not involved.
The next logical question: How does increased func- tionality impact clients’ activities? How does improved mobility impact other health conditions and how consumers interact with their environments?
Before CRT & After
Chart 1 shows how often clients fell within the last three months. The baseline number (in blue) shows fall
 Leaving the Home at Baseline & Follow up (n=357)
       Unknown 7 or More Times 4-6 Times 2-3 Times 1 or Less
0.00%
4.40%
9.52%
  15.07% 15.97%
      20.75% 19.05%
36.49% 33.61%
40.00%
 10.00% 20.00% 30.00% Baseline Follow-up
23.29% 21.85%
  Chart 3
MobilityMgmt.com
MOBILITY MANAGEMENT | AUGUST 2018 17
