
Page 18 - Mobility Management, August 2018
P. 18
CRT Trends: Big Data
Quality Assurance & the FMA
Secondary Health
Conditions & Environments How CRT Impacts Client Activities & Re-Admissions
In the July issue of Mobility Management, we reported
on how well wheelchair users said they functioned in 10 everyday situations, from carrying out daily routines to trans- ferring, being mobile indoors and being mobile outdoors.
Those questions are from the Functional Mobility Assessment (FMA), a 10-question survey of wheelchair users who self-reported their abilities on a scale of 1 (Completely Disagree) to 6 (Completely Agree).
Ultimately, the answers to those questions can also answer another critical question for the industry:
Does complex rehab technology (CRT) work, espe- cially when the building and fitting of complex rehab products are performed by Assistive Technology Professionals (ATPs)?
Quality Assurance Answers
So far, the results of the FMA — developed by a team at the University of Pittsburgh, including Mark Schmeler, Ph.D., OTR/L, ATP, Associate Professor, Department of
Rehabilitation Science & Technology — say yes.
U.S. Rehab, a division of The VGM Group, has world-
wide rights from Pittsburgh to “commercialize and collect data with the FMA,” U.S. Rehab President Greg Packer said. Although FMA papers will be submitted for publica- tion in scientific journals, Schmeler is emphatic in stating that the report cannot be called research until that point.
“This is quality-assurance work,” Schmeler said. “VGM has members who are businesses, and they need quality- assurance metrics to be certified, just like Uber drivers need a rating. Quality-assurance metrics are part of society and part of what we do.”
U.S. Rehab members using the survey have collected clients’ answers for years and currently use the scores to determine which consumers need closer follow-up and tracking after their CRT has been delivered. Participating clients use a range of primary insurance carriers, from Medicare (the most common payor, at 55.75 percent)
to Medicaid, private insurance/fee for service or HMO,
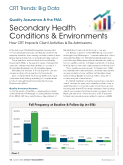
Fall Frequency at Baseline & Follow-Up (n=356)
80.00%
75.84%
60.00%
47.80%
40.00% 20.00% 0.00%
29.78%
11.80%
10.07%
4.21%
3-4 times Follow-up
7.19%
5 or more times
3.37%
5.16% 4.78% Unknown
None
1-2 times
Baseline
Chart 1
16 AUGUST2018|MOBILITYMANAGEMENT
MobilityMgmt.com
ABSTRACT BAR GRAPH: ISTOCKPHOTO.COM/ROYYIMZY
