
Page 53 - MSDN Magazine, May 2017
P. 53
of compliance with its SLA? For this demo purpose, we’ve created an exemplification telemetry proces- sor that collects all dependency calls that are out of compliance with 100 ms SLA, as shown in Figure 9.
Unlike exemplification, which, in fact, increases the volume of the collected telemetry for the pur- pose of more precise data fidelity, filtering is more radical as it drops telemetry items on the floor, making them completely invisible to the service. For demo purposes, we’ve created an exemplification telemetry processor that drops all dependency calls that are faster than 100 ms, as shown in Figure 10.
Telemetry filtering is effective
to reduce the amount of telemetry
and increase its quality. When you
know that the telemetry item isn’t
actionable, you don’t want to see it
in analytics. Using the telemetry processor in the previous example, you’ll only see dependency calls faster than 100 ms. So if you try to calculate the average duration of the dependency processing based on dependency record, you’ll get incorrect results.
Let’s try to address this by locally aggregating dependency call telemetry and sending “true” metrics to the service. To do so, we’re going to use a new metrics API and modify the telemetry processor to expose metrics before dropping telemetry, as shown in Figure 11.
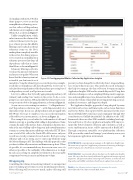
As you can see, we’re creating two metrics—“# of dependencies” and “dependencies duration (ms)”—with dimensionality of a dependency type. In our case, all dependency calls are tagged with HTTP type. If you go to Analytics, you can see the information collected for your custom metrics, as shown in Figure 12.
This example lets you calculate the total number of calls and duration your app is spending while calling to dependencies. Name contains the name of the metrics, that is, dependency duration (ms); value is the sum of all http calls to bing.com; and customDimensions contains a custom dimension called type with value HTTP. There were a total of 246 calls to the Track API call; however, only one record was stored per minute for each metric. Both processing efficiency and cost are strong cases to expose app telemetry using the MetricsManager API. The challenge with this approach is that you have to define all your metrics and dimensions up front. When it’s possible, it’s a recommended way; however, in some cases, it’s either not possible or the cardinality of the dimension is too high. In such cases, relying on sampled raw telemetry is the reasonable compromise between accuracy and telemetry volume.
Wrapping Up
Controlling the volume of monitoring telemetry is an important aspect of making good return on your monitoring investments. Over collecting will cost you too much; under collecting will msdnmagazine.com
Figure 12 Pre-Aggregated Metric Collected by Application Insights
prevent you from being able to effectively detect, triage and diag- nose your production issues. This article discussed techniques that help you manage the data collection footprint using the Application Insights SDK and its extensibility model. Using data reduction techniques, such as sampling, filtering, metrics aggrega- tion, and exemplification, it was demonstrated how to significantly decrease the volume of data while preserving monitoring accuracy, analytical correctness, and diagnostics depth.
The Application Insights approach is being adopted by many new Microsoft services and frameworks, such as Azure Functions and Service Fabric (this support will be announced at this year’s Microsoft Build 2017 conference) and community through OSS contribution on GitHub (bit.ly/2n1GFzF). In addition to the .NET Framework, there are other SDKs available, including JavaScript, Java and Node.js (Node.js Application Insights SDK improve- ments like better telemetry collection and correlation, as well as easier enablement in Azure, will be announced at Build 2017). Through a consistent, extensible, cross-platform data collection SDK, you can take control and “manage” your telemetry across your heterogeneous application environment. n
Victor Mushkatin is a group program manager on the Application Insights team. His main area of expertise is application performance monitoring technologies and DevOps practices. Reach him at victormu@microsoft.com.
sergey kanzheleV is a principal software developer on the Application Insights team. His career has been entirely dedicated to application monitoring and diagnostics. He’s passionate about connecting with customers, as well as an avid blog author and GitHub contributor. Reach him at sergkanz@microsoft.com.
thanks to the following technical experts for reviewing this article: Mario Hewardt, Vance Morrison and Mark Simms
May 2017 47
