
Page 52 - MSDN Magazine, May 2017
P. 52
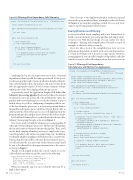
Figure 10 Filtering of Fast Dependency Calls Telemetry
Now, if you go to the Application Insights Analytics page and execute the query mentioned here, you might see the stats shown in Figure 8, proving that sampling worked. You see only a few requests representing many telemetry items.
Exemplification and Filtering
So far we’ve talked about sampling and you’ve learned how to build a custom telemetry processing pipeline and simple telem- etry processor. With this knowledge, you can explore two other techniques—filtering and exemplification. We made a couple of examples to showcase what you can do.
First, let’s take a look at the exemplification. Let’s say your application is dependent on a third-party service and it guarantees a certain performance SLA for processing requests. With the existing approach, you can collect samples of dependency calls. But what if you want to collect all evidences where that service was out
Figure 11 Filtering of Fast Dependency
Calls Telemetry with Metrics Pre-Aggregation
internal class DependencyFilteringTelemetryProcessor : ITelemetryProcessor {
private readonly ITelemetryProcessor next;
public DependencyFilteringTelemetryProcessor(ITelemetryProcessor next) {
this.next = next; }
public void Process(ITelemetry item) {
// Check telemetry type
if (item is DependencyTelemetry) {
var d = item as DependencyTelemetry;
if (d.Duration < TimeSpan.FromMilliseconds(100)) {
// If dependency duration > 100 ms then stop telemetry // processing and return from the pipeline
return;
} }
this.next.Process(item); }
}
internal class DependencyFilteringWithMetricsTelemetryProcessor
: ITelemetryProcessor, IDisposable
{
private readonly ITelemetryProcessor next;
private readonly ConcurrentDictionary<string, Tuple<Metric, Metric>> metrics
= new ConcurrentDictionary<string, Tuple<Metric, Metric>>(); private readonly MetricManager manager;
public DependencyFilteringWithMetricsTelemetryProcessor( ITelemetryProcessor next, TelemetryConfiguration configuration)
{
this.next = next;
this.manager = new MetricManager(new TelemetryClient(configuration));
}
public void Process(ITelemetry item) {
// Check telemetry type
if (item is DependencyTelemetry) {
var d = item as DependencyTelemetry;
// Increment counters
var metrics = this.metrics.GetOrAdd(d.Type, (type) => {
var dimensions = new Dictionary<string, string> { { "type", type } }; var numberOfDependencies =
this.manager.CreateMetric("# of dependencies", dimensions); var dependenciesDuration =
this.manager.CreateMetric("dependencies duration (ms)", dimensions); return new Tuple<Metric, Metric>(
numberOfDependencies, dependenciesDuration); });
// Increment values of the metrics in memory metrics.Item1.Track(1); metrics.Item2.Track(d.Duration.TotalMilliseconds);
if (d.Duration < TimeSpan.FromMilliseconds(100)) {
// If dependency duration > 100 ms then stop telemetry // processing and return from the pipeline
return;
} }
this.next.Process(item); }
public void Dispose() {
this.manager.Dispose(); }
}
Analyzing this log, for each request you can see trace, event and dependency telemetry with the same operation id. At this point, you have an app that sends various Application Insights telemetry types, automatically collects dependency calls and correlates them all to the appropriate requests. Now, let’s reduce telemetry volume utilizing out-of-the-box sampling telemetry processors.
As previously stated, the Application Insights SDK defines the telemetry processing pipeline that’s used to reduce the amount of telemetry sent to the portal. All collected telemetry enters the pipeline and every telemetry processor decides whether to pass it further along. As you’ll see, configuring of sampling with the out- of-the box telemetry processors is as easy as registering them in the pipeline and requires just a couple lines of code. But in order to demonstrate the effect of those processors, we’ll slightly modify the program and introduce a helper class to showcase the reduction ratio.
Let’s build the Telemetry Processor that’ll calculate the size of the telemetry items going through, as shown in Figure 6.
Now you’re ready to build the telemetry processing pipeline. It will consist of four telemetry processors. The first one will calculate the size and count of telemetry sent into the pipeline. Then, you’ll use the fixed sampling telemetry processor to sample only 10 per- cent of dependency calls (in this case, ping to bing.com). In addition, you’ll enable adaptive sampling to all telemetry types, except Events. It means that all events will be collected. The last telemetry proces- sor will calculate the size and count of the telemetry items that’ll be sent to the channel for subsequent transmission to the service, as shown in Figure 7.
Finally, you’ll slightly modify the console output to see the collected and sent telemetry and the ratio for the reduction:
Console.WriteLine($"Iteration {iteration}. " + $"Elapsed time: {operation.Telemetry.Duration}. " + $"Collected Telemetry: {collectedItems}. " + $"Sent Telemetry: {sentItems}. " +
$"Ratio: {1.0 * collectedItems / sentItems}");
When executing the app you can see that the ratio may be as high as three times!
46 msdn magazine
DevOps
