
Page 9 - spaces4learning, Spring 2023
P. 9
2023 FACILITIES & CONSTRUCTION BRIEF spaces4learning
(See nces.ed.gov/programs/digest/d22/tables/dt22203.10.asp.) Private PreK–12 school data are a bit more murky. NCES has
not yet updated projections for private schools since early 2020, and its estimates then were based on pre-pandemic trends. We will include data on private schools from the 2020 source in the table below.
Overall, projections for enrollments in PreK–12 education have been revised downward — where revisions have been made to previous data — through 2030.
DEGREE-GRANTING POST-SECONDARY
In higher education, 18.96 million students were projected to attend colleges and universities in 2022. Of those:
• 11.55 million were full-time.
• 7.4 million were part-time.
• 13.86 million were enrolled in public institutions. • 5.1 million were enrolled in private institutions.
Overall, projections for enrollments in higher education have been revised downward through 2030.
ENROLLMENT PROJECTIONS (IN THOUSANDS)
Year
All
pK-12
pK-12: Public
pK-12: Private***
egreeranting ostsecondar
Total
pK-8
9-12
Total
pK-8
9-12
Total
Public
Private
2010
75,886
54,867
49,484
34,625
14,860
5,382
4,084
1,299
21,019
13,703
4,379
2020
74,116
55,089
49,375
34,061
15,314
5,714
4,183
1,531
19,027
13,884
5,142
2021
73,812
55,153
49,453
34,004
15,449
5,700
4,161
1,539
18,659
13,543
5,116
2022
74,609
55,648
49,935
34,360
15,575
5,713
4,171
1,542
18,961
13,863
5,097
2030
73,157
52,991
47,253
32,261
14,992
5,738
4,281
1,457
20,166
14,736
5,430
rojected. Note that data are taken from three sources from NCES. Where data disagree, we have used the most recent source. Source for all data prior to 2021 and private PreK–12 data for 2021, 2022, and 2030: National Center for Education Statistics, Enrollment in elementary, secondary, and degree-granting postsecondary institutions, by level and control of institution, enrollment level, and attendance status and sex of student: Selected years, fall 1990 through fall 2029. Source for 2021, 2022, and 2030 public PreK–12 data: nces.ed.gov/programs/digest/d21/tables/dt21203.10.asp. Source for 2021, 2022, and 2030 higher education data: nces.ed.gov/programs/digest/d22/tables/dt22303.10.asp.
Data or projections revised since our previous report
NCES has not revised data or projections of private PreK–12 enrollment since before the pandemic.
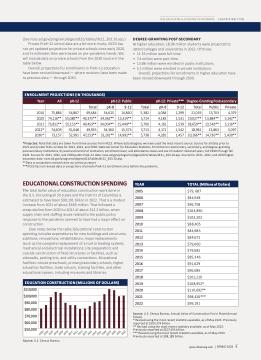
EDUCATIONALCONSTRUCTIONSP ENDING
T h e total dollar value of education construction work done in the U.S. (including all 50 states and the District of Columbia) is estimated to have been $99,191 billion in 2022. That is a modest increase from 2021 of about $665 million. That followed a
steep decline from 2020 to 2021 of about $12.2 billion, when supply chain and stang issues related to the public policy response to the pandemic seemed to have had a major eect on construction.
(See notes below the table.)Educational construction spending includes expenditures for new buildings and structures; additions; renovations; rehabilitations; major replacements
(such as the complete replacement of a roof or heating system); mechanical and electrical installations; site preparation; and outside construction of fixed structures or facilities, such as sidewalks, parking lots, and utility connections. Educational facilities include preschools, primary/secondary schools, higher education facilities, trade schools, training facilities, and other educational spaces, including museums and libraries.
YEAR
TOTAL(M illionsofDollars)
2005
$79, 687
2006
$84,928
2007
$96,758
2008
$104,890
2009
$103,202
2010
$88,405
2011
$84,985
2012
$84,672
2013
$79,060
2014
$79,681
2015
$85,346
2016
$91,629
2017
$96,685
2018
$101,210
2019
$108,952
2020
$110,692
2021
$98,426
2022
$99,191
EDUCATION CONSTRUCTION (MILLIONS OF DOLLARS)
$110,000 $100,000 $90,000 $80,000 $70,000 $60,000 $50,000
2005
2006
2007
2008
2009
2010
2011
2012
2013
20124015
2016
2017
2018
2019
2020
2021
2022
Source: U.S. Census Bureau, Annual alue of Construction Put in Place (Annual Totals).
Revised using the most recent statistics available, as of May 2023. Previously reported at $105.374 billion.
Revised using the most recent statistics available, as of May 2023. Previously reported at $107.435 billion.
Revised using the most recent statistics available, as of May 2023. Previously reported at $98,189 billion.
Source: U.S. Census Bureau
spaces4learning.com | SPRING 2023 9
