
Page 8 - spaces4learning, Spring 2023
P. 8
spaces4learning
2 0 2 3 FACILITIES & CONSTRUCTION B RIEF
A
W
Whereas 2021 saw the first decline in construction spending since 2013, 2022 rebounded slightly, though a number of lingering fac- tors continue to challenge the sector — including labor shortages, increasing costs of materials and labor, uncertainties impacting planning and budgeting, and ongoing supply chain issues leading to, among other things, delays in completing projects.
Private construction spending on education saw substantial gains for the first time in three years, accounting for all of the growth from 2021 to 2022. Private spending totaled $18.89 billion, up more than $2.7 billion from 2021 and about $189 million from 2020.
Public construction spending on education, meanwhile, declined by $2 billion, the second decline in a row following
seven straight years of growth. Public spending was $80.3 billion, down from $82.319 billion in 2021, which was down from $91.89 billion in 2020.
The biggest issues impacting construction in the last year? Workforce shortages and turnover, supply chain problems, and rising costs of labor and materials.
Said one participant in this year's Spaces4Learning Construction Brief survey: "Increasing costs [are] causing projects to come in over budget, and supply chain issues [are] impacting schedules (both during planning and unknowns during construction)."
Of course, funding continued to be a major hurdle as well.
By David Nagel, editor-in-chief and editorial director of 1105 Media's Education Group.
CHANGES IN P OP ULATION AFFECT ENROLLM ENT
P OP ULATION CHANGE
B e tween 2020 and 2021, the population of the United States
grew just0.12%.Between2021and2022,therateofgrowth increased to 0.4%. That amounted to an increase of 1.256 million people to the U.S. population, bringing the total to 333,287,557, according to the United States Census Bureau.
For the second time in history (and the second year in a row), the natural increase in population (births minus deaths) fell below increases in population owing to international migration. In other words, there were more net international migrants adding to the U.S. population (1.011 million) than net gains through childbirth minus deaths (245,080) — although 2022 saw the largest year- over-year increase in births since 2007.
Some stats for the year based on current estimates (as of May 2023) include:
• The total population of the United States at the end of 2022
was 333.29 million, according to the U.S. Census Bureau. The total population at the end of 2021 was 331.9 million. The total population of the United States at the end of 2020 was 330.03 million. The population at the end of 2019 was 329.16 million.
• There was roughly one death every 10 seconds and one birth every nine seconds, with one net gain from immigration every 32 seconds.
• Twenty-four states, as well as Puerto Rico, saw more deaths than births (natural declines).
• Twenty-six states and the District of Columbia saw more births thandeaths.
Eighteen states saw population declines from 2021 to 2022 — including the most populous state in the nation, California, which
ENROLLM ENT ESTIM ATES PRE-
ource U.S. Census Bureau, Annual Estimates of the Resident Population for the United States, Regions, States, and the District of Columbia: April 1, 2021 to July 1, 2022 See census.gov/newsroom/press-releases/2022/2022- population-estimates.html.
declined by 113,649 this year, following a decline of 260,000 last year. California saw the highest net loss of population from domestic "outmigration" (343,230 Californians moving to other states), while it also saw a natural increase of 106,155 and an increase through immigration of 125,715. New York once again saw the largest numeric and percent decrease in population, losing 180,341 inhabitants in 2022 (0.9%), following a decline of 319,000 the previous year.
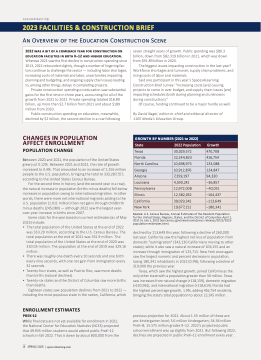
Texas, which saw the highest growth, joined California as the only other state with a population greater than 30 million. Texas saw increases from natural change (+118,159), domestic migration (+230,961), and international migration (+118,614). Florida had the highest percentage growth, 1.9%, adding 416,754 residents, bringing the state's total population to about 22.245 million.
previous projection for 2022. About 1.55 million of those are pre-kindergarten level; 3.6 million kindergarten; 34.36 million PreK–8; 15.575 million grades 9–12. 2022's projected public school enrollment was up slightly from 2021. But following 2022, declines are projected in public PreK–12 enrollment every year.
GROTH Y NUMER ( t o )
tate
2022 opulation
rowth
Texas
30,029,572
470,708
Florida
22,244,823
416,754
NorthCarolina
10,698,973
133,088
Georgia
10,912,876
124,847
Arizona
7,359,197
94,320
Louisiana
4,590,241
–36,857
Pennsylvania
12,972,008
–40,051
Illin o is
12,582,032
–104,437
California
39,029,342
–113,649
NewYork
19,677,151
–180,341
h i le final data are not yet available for enrollment in 2022, the National Center for Education Statistics (NCES) projected that 49.935 million students would attend public PreK–12 schools in fall 2022. That is down by about 800,000 from the
8 SPRING 2023 | spaces4learning.com
