
Page 17 - MSDN Magazine, February 2018
P. 17
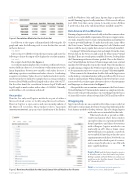
Figure 4 Correlation Matrix for the Iris Data Set
Scroll down to the empty cell immediately following the 3D graph and enter the following code to view the first five records in the iris data set:
iris.head(5)
Choose Insert Cell Below from the Insert menu and enter the following code into the empty cell to display the correlation matrix:
iris.corr()
The output should look like Figure 4.
A correlation matrix displays the correlation coefficient between various fields in a data set. A correlation coefficient measures the linear dependence between two variables, with values closer to 1 indicating a positive correlation and values closer to -1 indicating a negative correlation. Values closer to 0 indicate a lack of correla- tion between the two fields. For example, there’s a strong correlation between Petal Width and Petal Length with a value of 0.962757. On the other hand, the correlation between Sepal Width and Sepal Length is much weaker with a value of -0.109369. Naturally, each field has a 1.0 correlation with itself.
Anacondas
Thus far, I’ve only used Jupyter notebooks as part of either a Microsoft cloud service or locally using Microsoft software. However, Jupyter is open source and can run independent of the Microsoft ecosystem. One popular toolset is Anaconda (anaconda.com/download), an open source distribution of the Python
and R for Windows, Mac and Linux. Jupyter ships as part of this install. Running Jupyter locally initializes a Web server locally on port 8888. Note that, on my system, I can only create a Python 3 notebook as that is the only kernel I have installed on my PC.
Data Science Virtual Machines
Running a Jupyter notebook server locally is ideal for scenarios where Internet access isn’t reliable or guaranteed. For more compute-inten- sive tasks, it may be wiser to create a virtual machine and run Jupyter on more powerful hardware. To make this task easier, Azure offers the Data Science Virtual Machine image for both Windows and Linux, with the most popular data science tools already installed.
Creating a VM from this image is fast and simple. From the Azure Portal, click on the New icon and search for Data Science Virtual Machine” There are several options available. However, I’ve found that the Ubuntu image is the most feature-packed. Choose the Data Sci- ence Virtual Machine for Linux (Ubuntu) image and create a virtual machine by following the steps in the wizard. Once the machine is up and running, configure the VM for remote desktop access. Refer to documentation on how to connect to a Linux VM at bit.ly/2qgHOZo.
When connected to the machine, double-click on the Jupyter icon on the desktop. A terminal window will open, followed by a browser window a moment later. When clicking on the New button to create a new notebook, you have quite a few more choices of environments and languages, as demonstrated in Figure 5.
Along with the various runtime environments, the Data Science Virtual Machine for Ubuntu includes numerous sample notebooks. These notebooks provide guidance on everything from the basics of Azure ML to more advanced topics like CNTK and TensorFlow.
Wrapping Up
Jupyter notebooks are an essential tool for data science work, but they tend to confuse many developers because the platform lacks the basic features needed to develop software. This is by design. Jupyter
notebooks are not intended for that task. What notebooks do is provide a collab- orative mechanism where data scientists can explore data sets, experiment with dif- ferent hypotheses and share observations with colleagues. Jupyter notebooks can run locally on a PC, Mac or Linux. Azure ML Workbench even includes a notebook server embedded into the product for easier experimentation with data. Notebooks can also be run in the cloud as part of a service, such as Azure Notebooks, or on a VM with more capable hardware. n
Frank La Vigne leads the Data & Analytics practice at Wintellect and co-hosts the DataDriven podcast. He blogs regularly at FranksWorld.com and you can watch him on his YouTube channel, “Frank’s World TV” (FranksWorld.TV).
Thanks to the following technical experts for reviewing this article: Andy Leonard
February 2018 13
Figure 5 Runtimes Available for the Data Science Virtual Machine for Ubuntu msdnmagazine.com
