
Page 38 - MSDN Magazine, October 2017
P. 38
The Run method takes an IBackgroundTaskInstance parame- ter value directly. Recall that the foreground handler obtained this value from the TaskInstance member of the BackgroundActivated- EventArgs parameter of OnBackgroundActivated. Aside from this difference in obtaining the taskInstance, the implementation is identical for both handlers. Copy the remaining implementation from your foreground handler’s App.xaml.cs file.
Testing a Packaged Plug-in
Deploying the Plug-in To test your plug-in, you must first deploy it, either via Visual Studio F5 deployment or by using loose .appx files (generated via the Visual Studio Project | Store | Create App Packages menu). Let’s use the former. Right-click on the MyApp project node and select Properties. In the project property sheet, select the Debug tab and then enable the Do not launch checkbox.
I suggest setting a breakpoint in your RequestReceived event handler, and possibly in your plug-in’s entry point—either your BackgroundActivated event handler or Run method override. This will confirm that your plug-in is properly configured and success- fully activating when you test it in the next section. Now, press F5 to deploy and debug your app.
Running WDP in Debug Mode After deploying your package, WDP must be restarted to detect it. (In case you skipped the WDP introduction mentioned earlier, you may also need to install the Developer Mode package now to ensure WDP is available). This can be done by toggling the Enable Device Portal checkbox from the Settings app’s Update & security | For developers page. However, I’m going to instead run the WDP Service in debug mode as a con- sole app. This will allow me to see WDP trace output, which will help when troubleshooting packaged plug-in configuration and execution issues. The WDP service is configured to execute under the SYSTEM account, and this is also required when running WDP in debug mode. The PsExec utility, available as part of the PsTools suite (bit.ly/2tXiDf4), will help do that.
First, create a SYSTEM console, running PsExec from within an Administrator console:
> psexec -d -i -s -accepteula cmd /k title SYSTEM Console - Careful!
This command will launch a second console window running in the SYSTEM account context. Normally, this window uses the legacy console, and new console features, such as text wrap on resize, text selection enhancements and clipboard shortcuts, aren’t available. If you want to enable these features when running as SYSTEM, save the following to a registry script file (for example, EnableNewConsoleForSystem.reg) and execute it:
Windows Registry Editor Version 5.00
[HKEY_USERS\.DEFAULT\Console] "ForceV2"=dword:00000001
In the SYSTEM console, run WDP in debug mode, enabling both clear and encrypted requests:
> webmanagement -debug -clearandssl
You should see output similar to that in Figure 9. To safely termi- nate WDP in debug mode, simply press Ctrl+C. This will maintain your SYSTEM console so you can iterate on plug-in development.
Note that the trace output uses various terms: webmanagement, WebB and WDP. These exist for historical reasons and refer to different subsystems, but the distinctions can be ignored. Also
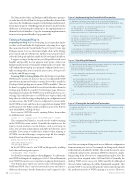
Figure 6 Implementing the DevicePortalConnection
// Implement background task handler with a DevicePortalConnection protected override void OnBackgroundActivated(BackgroundActivatedEventArgs args) {
// Take a deferral to allow the background task to continue executing var taskInstance = args.TaskInstance;
this.taskDeferral = taskInstance.GetDeferral(); taskInstance.Canceled += TaskInstance_Canceled;
// Create a DevicePortal client from an AppServiceConnection
var details = taskInstance.TriggerDetails as AppServiceTriggerDetails; var appServiceConnection = details.AppServiceConnection; this.devicePortalConnection =
DevicePortalConnection.GetForAppServiceConnection( appServiceConnection);
// Add handlers for RequestReceived and Closed events devicePortalConnection.RequestReceived += DevicePortalConnection_RequestReceived; devicePortalConnection.Closed += DevicePortalConnection_Closed;
}
Figure 7 Handling the Request
// RequestReceived handler demonstrating response construction, based on request private void DevicePortalConnection_RequestReceived(
DevicePortalConnection sender,
DevicePortalConnectionRequestReceivedEventArgs args) {
if (args.RequestMessage.RequestUri.AbsolutePath.ToString() == statusUri.ToString())
{
args.ResponseMessage.StatusCode = HttpStatusCode.Ok; args.ResponseMessage.Content =
new HttpStringContent("{ \"status\": \"good\" }"); args.ResponseMessage.Content.Headers.ContentType =
new HttpMediaTypeHeaderValue("application/json"); }
else {
args.ResponseMessage.StatusCode = HttpStatusCode.NotFound; }
}
Figure 8 Closing the DevicePortalConnection
// Complete the deferral if task is canceled or DevicePortal connection closed private void Close()
{
this.devicePortalConnection = null;
this.taskDeferral.Complete(); }
private void TaskInstance_Canceled(IBackgroundTaskInstance sender, BackgroundTaskCancellationReason reason)
{ Close();
}
private void DevicePortalConnection_Closed(DevicePortalConnection sender, DevicePortalConnectionClosedEventArgs args)
{ Close();
}
34 msdn magazine
Windows Device Portal
note that executing in debug mode uses a different configuration from executing as a service. For example, in debug mode, default authorization is disabled by default. This avoids the need to enter credentials and prevents automatic HTTPS redirection, simpli- fying testing from a browser or command-line utility. Also, the ports have been assigned values 54321 and 54684. Normally, the desktop WDP service uses ports 50080 and 50443 (although if these are taken, random ports will be dynamically assigned). This permits WDP to execute in debug mode without interfering with the production mode of WDP running as a service. However,
