
Page 39 - MSDN Magazine, October 2017
P. 39
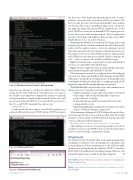
Figure 9 Windows Device Portal in Debug Mode
it may become irksome to switch port numbers on URLs when testing, based on the WDP mode of execution. If so, you can use the -httpPort and -httpsPort command-line options to explicitly set the port numbers to match production mode. In this case, you’ll need to ensure that the WDP service is turned off to prevent con- flicts. To see all WDP command-line options, type:
> WebManagement.exe -?
As indicated in the trace output, several built-in plug-ins are automatically loaded as part of WDP startup. WDP then reports
Figure 10 Testing with Curl
Figure 11 Testing with the Browser msdnmagazine.com
the discovery of the deployed packaged plug-in with “Found 2 packages” (more precisely, one package with two providers). The first provider describes the foreground handler, and confirms reservation of the static ContentRoute URL and its correspond- ing mapped package file path and REST HandlerRoute. At this point, WDP has created an on-demand HTTP request queue to service these routes and is awaiting requests. The second provider describes the background handler, which specifies only a REST HandlerRoute. It, too, is ready for business.
Executing the Plug-in I recommend developing and testing your plug-in with the excellent command-line utility I mentioned earlier, curl. For simpler scenarios, a browser is adequate, but curl affords fine-grained control over headers, authentication and so on. This makes it easier to use when WDP encryption, authentication and CSRF protection options are enabled. In these situations, the curl “—verbose” option is also useful for troubleshooting.
Figure 10 demonstrates requesting the foreground handler’s resources: its status REST API and Web page.
Figure 11 shows using the browser to request the app’s status page, in turn demonstrating the embedded REST API calls.
When any requests are made to your plug-in’s routes, the breakpoint you set in your entry point should hit in the debugger. And for REST API requests specifically, the breakpoint in your RequestReceived event handler should hit. You should also see confirmation in the WDP diagnostic output that the packaged plug-in was activated.
Troubleshooting It’s worth noting a few of the common errors that prevent correct execution of a handler:
• Manifest mismatches, such as AppService name or entry point • Neglecting to add a background handler component
project reference to the app
• Deploying with an architecture mismatch between the
package and the service
• Implementing IBackgroundTask in your app project, rather
than as a Windows Runtime Component
When running in debug mode, WDP will provide specific diag-
nostic messages for these errors, where possible. After three failed attempts to activate a plug-in, WDP will disable the plug-in for that session as indicated with the diagnostic:
WDP Packaged Plugin: Disabling request queue after 3 failed attempts
After making corrections to your package manifest or code, it’s usuallynecessarytorestartWDP,bothtoresetthedisabledcounter and to rescan for package configuration changes.
Wrapping Up
The Windows Device Portal API offers a safe, simple mechanism for extending your Windows Store app’s diagnostics capabilities with packaged plug-ins. Future enhancements to this API will enable integration of packaged plug-ins within the WDP UI, introduce REST APIs for installing and controlling packaged plug-ins, and expand the applications possible for packaged plug-ins. n
Scott JoneS works for Microsoft as a software engineer on the Application Platform and Tools team.
thankS to the following Microsoft technical expert for reviewing this article: Hirsch Singhal
October 2017 35
