
Page 56 - MSDN Magazine, September 2017
P. 56
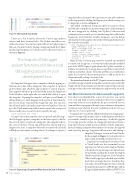
Figure 3 The Update Controller
There are a few locations where the Visitors app updates visitors (and their SecurityCodes). The Update controller is one of those locations. You can investigate if there’s an Update request that sets a SecurityCode by placing a Snappoint inside the Update method and turning it on with the Start Collection button, as shown in Figure 3.
The Snapshot Debugger session functions a lot like a local debugging session on your development box.
The Snapshot Debugger takes a snapshot when the app in pro- duction runs a line with a Snappoint. This snapshot is captured in about 10ms, after which the app continues to execute requests. This snapshot will show up in Visual Studio inside the Diagnostic Tools Window on the right side; you can double-click it to open the snapshot. Opening the snapshot will give you all kinds of debug details as to what happened at the point of time when the line of code where you placed the Snappoint runs. You can view the call stack and Locals in their respective tool windows. You can go to the Watch window and add visitor.SecurityCode to inspect if there actually was a SecurityCode accepted by the app:
visitor.SecurityCode null string
SecurityCode on this snapshot is just as expected: null. The Snap- shot Debugger captures a snapshot on the first request to hit the line of code where you placed a Snappoint. This snapshot reflects the correct behavior of your app and therefore doesn’t help you diagnose the issue. A snapshot where the SecurityCode isn’t null will help you investigate your hypothesis. To attempt to capture a
snapshot when a SecurityCode is present, you can add conditions to the Snappoints by clicking the Options gear when hovering over a Snappoint, as shown in Figure 4.
The added conditional statement will let you narrow down and only take a snapshot on an interesting request. After turning on the new Snappoint by clicking Start/Update Collection and waiting for a few seconds, you see another snapshot visible in the Diagnostic Tools Window. Double-clicking to view the debug information for this snapshot shows the following information for
the visitor local variable:
visitor {MyCompany.Visitors.Model.Visitor} MyCompany.Visitors.Model.Visitor Company "Microsoft" string
Email "toroidking@microsoft.com" string
FirstName "Jackson" string
LastName "Davis" string
Position "Principal Software Engineer" string SecurityCode "SecretProjects" string VisitorId 7 int
Bam! It looks as if your app somehow accepted an unverified SecurityCode. It appears as if someone had manually modified part of the HTTP request’s payload into the Update controller to add in a SecurityCode. Your app then accepted the SecurityCode without any further checks. To fix this problem, you could either make the SecurityCode property private or add in checks for clients manually setting a SecurityCode.
The manual modification of the PUT request was not a scenario that you built your app to handle, nor had this scenario been tested locally. Snappoints let you investigate real customer requests that come into your app to detect the error with almost no impact to the site itself.
Get More Information On Demand with Logpoints
Now that you’ve identified the source of your error, you can fix your code and deploy it into production. However, it might be some time before you can make the fix, get it reviewed by your team and have it propagate through your continuous integration systems up to production. For now, you’ll keep track of every user who tries to set a SecurityCode.
Logpoints let you add this additional temporary logging mes- sage to your app without any restart or redeployment and they let you evaluate variables to put in log messages. To add a Logpoint to your app, go to the settings on a Snappoint and convert it into a Logpoint (note any conditions you set will also work for Logpoints). Instead of taking a snapshot when the line of code runs, the app will emit a new log message. Logpoints will stay active only during a
Snapshot Debugger session in Visual Studio. In the example in Figure 5, you log the visitor’s name when an invalid SecurityCode is set.
Logpoints can send logs to two places: back to Visual Studio in a live stream and to your app’s log store. When Send to Output Window is checked, new log messages stream back into Visual Studio and display in both the Output Window and the Diagnostic Tools Window. When Send to app logs is checked, you send the logs back to your app’s log store. To achieve this, you make a System.Diagnostics.Trace call with theinputlogmessageforASP.NETappsandan ILogger.LogInformation call for ASP.NET Core
ASP.NET Core
Figure 4 Capturing a Snapshot When SecurityCode Is Present 48 msdn magazine
