
Page 55 - MSDN Magazine, September 2017
P. 55
Snappoints. Like a breakpoint you set in your app while debug- ging on your development box, Snappoints are placed on a line of code you specify. When your app hits a Snappoint, the Snapshot Debugger takes a snapshot of the app, letting you inspect the call stack, local variables and objects on the heap. Unlike breakpoints, the app doesn’t stop. Customers interacting with your app won’t realize that you’re currently debugging your app.
Logpoints. These let you insert additional log statements into a live production service in cases where you might not have log messages that detail a production issue. These new log statements are temporary and cause no side effects to your app.
Conditions. Only a fraction of the number of requests hitting a live app might be interesting or result in error. Conditional state- ments you specify apply to both Snappoints and Logpoints to ensure that you only get diagnostics information on interesting requests that might help identify the root cause of the problem.
Currently, the Snapshot Debugger is in public preview for ASP.NET and ASP.NET Core apps running on Azure App Services. You can download and try out the Snapshot Debugger at aka.ms/snappoint.
Debug Safely in Production with Snappoints
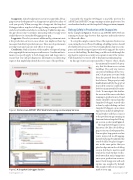
In the example in Figure 1, Visitors is an ASP.NET MVC Web site running on Azure App Services that registers and tracks visitors to Microsoft offices.
To set up this sample scenario: One of the registered visitors was seen exiting the Secret Project building, a building visitors should absolutely not have access to! You’ve frantically fired up your com- puter and started trying to figure out how the app gave the visitor access to the building. The first thing you did was look through the app logs for suspicious security access grants to any of the visitors. Unfortunately, you weren’t able to find any incriminating logs.
In this app, visitors are represented by a “Visitor” object, which has an internal SecurityCode prop- erty that lets them access certain buildings. The only way visitors can enter a building is if the Secu- rityCode property associated with them has granted them the right level of access. This property is only handled internally by the app, but it’s possible someone could some- how force in an unverified Security- Code. To investigate this further, the version of the source code that’s running in production in Visual Studio should be opened and the Snapshot Debugger started (this is done by right-clicking on Start Snapshot Debugger on an Azure App Service in the Cloud Explorer). Visual Studio will then connect to the production app running in Azure and enter a Snapshot Debug- ger session, as shown in Figure 2. The Snapshot Debugger session functions a lot like a local debug- ging session on a development box. You can place Snappoints on a line you’re interested in debugging, instead of placing breakpoints like you do locally. You place Snappo- ints in the same gutter that you place breakpoints in a local debug session, but they’re inactive until you hit the Start/Update Collec- tion button that turns Snappoints on in your production environ- ment. Each Snappoint will only capture one snapshot by default: This snapshot reflects one request
Figure 1 Visitors Is an ASP.NET MVC Web Site Running on Azure App Services
Figure 2 A Snapshot Debugger Session msdnmagazine.com
made to your app.
September 2017 47
