
Page 58 - MSDN Magazine, September 2017
P. 58
apps. If you configure your logging framework to listen to System.Di- agnostics or ILogger, the logs will appear in conjunction with any other app logs you currently collect.
Logpoints don’t cause any side effects to your app in production. The Snapshot Debugger virtually executes the input log statements in a way that can’t alter the state or exe- cution of your app in production.
By using Logpoints, you’re now
tracking any user who’s trying to use
a SecurityCode in your app. You’re
collecting new log information in
a part of your app that previously
generated no logs. Logpoints let you get additional contextual information about your app, only where and when you need it.
How Snapshot Debugging Is Production-Ready
The Snapshot Debugger aims to bring the ease of the Visual Studio debugging experience to a production scale for apps running in Azure. The process of capturing snapshots on a live app is mini- mally intrusive. Performance measurements show that Snapshot Debugger has a negligible impact to the speed of your app.
Snapshot Debugger is intended to be used on Release build ver- sions of your app. Currently, debugging Release versions of managed apps can be challenging, as debugger controller might be slightly off due to function optimization and in-lining in Release build apps. The Snapshot Debugger gives you much better support for debugging Release build apps. It recompiles functions containing Snappoints with optimizations and in-lining temporarily disabled. Resulting snapshots in these functions are, therefore, more easily “debuggable.” When you end your Snapshot Debugger session, the functions are recompiled once more and returned to their original production state.
When the Snapshot Debugger captures a snapshot of your app, it creates a fork of the app’s process. This snapshot, or forked process, reflects the full state of the app and the app’s heap at the point of time when the snapshot was taken. However, this snapshot doesn’t imme- diately copy the full heap of the app; instead, it only copies the page table and sets pages to copy on write. If some of the app’s objects on the heap change, their respective pages are then copied into the forked process. Each snapshot, therefore, requires only a small memory cost (on the Visitors app used in the example, the memory consumed by each snapshot was in the hundreds of kilobytes).
The Snapshot Debugger aggressively throttles the number of snapshots created to ensure that it puts minimal memory pres- sure on your production server. The Snapshot Debugger won’t take snapshots if the amount of free memory on your server is too low. Additionally, snapshots only exist while the Snapshot Debugger session in Visual Studio is active. When you stop the Snapshot Debugger session, all snapshot processes are killed.
Snappoints also let you investigate a request as it progresses through different lines of your code. Unlike breakpoints, you can’t step between Snappoints. However, you can place multiple
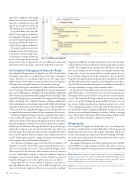
Figure 5 Adding a Logpoint
Snappoints at different locations of interest in your code. The Start/ Update Collection button will turn on all the Snappoints you place in bulk. Two Snappoints in one function will result in two snap- shots in the Diagnostic Tools Window, assuming both lines with Snappoints execute. You can switch between the snapshots to see how variables change from the first snapshot to the second. The Snapshot Debugger will ensure that groups of Snappoints enabled in bulk will result in related snapshots. Two snapshots in one func- tion will both be from the same request, even if there are hundreds of requests hitting your app at that moment in time.
In a production environment, there can be many servers running identical instances of your app. In some cases, interesting requests that might reflect an error may be rare and only occur on specific servers. The Snapshot Debugger enables you to investigate these issues as it supports debugging against multiple instances of your app at once. Snappoints placed in a function activate across every server running an instance of your app. Only the first instance to executethelinewiththeSnappointwillcaptureasnapshot.Youcan, therefore, use conditional statements to analyze seldom-occurring issues. The Snapshot Debugger will take the resulting snapshot only on the server where the input conditions become true.
Wrapping Up
The Snapshot Debugger was built after years of working with developers and listening to their difficulties in debugging and diagnosing production issues. The Snapshot Debugger enables you to have a rich diagnostics experience when developing .NET apps for Azure, in turn letting you save time and money when you run into inevitable production issues.
The Snapshot Debugger is currently in public preview for ASP.NET and ASP.NET Core apps running on Azure App Services. You can download the Snapshot Debugger and try it out at aka.ms/snappoint. n
Nikhil Joglekar is a program manager at Microsoft, focusing on debugging and diagnostics for Azure services. He has worked on the Snapshot Debugger, Visual Studio Profiler and Azure SDK since joining Microsoft two years ago. Contact him at Nikhil.Joglekar@microsoft.com or on Twitter: @nikjogo.
ThaNks to the following Microsoft technical experts for reviewing this article: Jackson Davis and Andy Sterland
50 msdn magazine
ASP.NET Core
