
Page 8 - School Planning & Management, January/February 2019
P. 8
2019 FACILITIES & CONSTRUCTION BRIEF
An Overview of the Education Construction Scene
While there is much we can’t predict, there are a few things we know for sure. We know that the population of the U.S. is growing and along with it the enrollment in our K-12 schools. We know that there is a growing need for an educated workforce, affecting the enrollment of colleges and universities nationwide. We know that there is an ongoing deferred maintenance problem and a need to invest in the improvement of existing facilities. We also know that the construction and renovation of educational facilities is finally on the rise.
The following information is provided to give you a brief
overview of what we know based on available data and a survey of our readers. In past reports, we’ve provided national medians on specific facility types, but this year accurate data was scarce, the sample size too small, and the project scope too varied. What you find here are the trends in population and enrollment, the trends in overall education construction spending, and the results of our reader survey—giving you an overview of the trends in facilities and construction.
The SP&M/CP&M Editorial Team
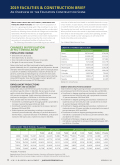
CHANGES IN POPULATION AFFECT ENROLLMENT
POPULATION CHANGE
• One birth every 8 seconds
• One death every 11 seconds
• One international migrant (net) every 34 seconds • Net gain of one person every 19 seconds
States in the South and West continued to lead in population growth. Nationally, the U.S. population grew by 0.6 percent. Nevada and Idaho were the fastest-growing states, both increasing by about 2.1 percent. In addition, Utah grew by 1.9 percent, Arizona by 1.7 percent, and Florida and Washington by 1.5 percent. Nine states lost population last year. New York had the largest numeric decline, losing 48,510 people. Texas had the largest numeric growth over the last year, with an increase of 379,128 people.
ENROLLMENT PROJECTIONS
ELEMENTARY AND SECONDARY
Total public and private elementary and secondary school enrollment was 56 million in fall 2014, the last year of actual public school data. Between fall 2014 and fall 2026, an increase of 3 percent is expected. Public school enrollments are projected to be higher in 2026 than in 2014 for the South and West, and be lower for the Northeast and Midwest.
• Enrollment in prekindergarten through grade 8 is projected to
increase 2 percent between 2014 and 2026.
• Enrollment in grades 9-12 is projected to increase 2 percent
between 2014 and 2026.
• Public elementary and secondary enrollment is projected to
increase 3 percent nationally, reflecting a 5-percent decrease in the Northeast, a 3-percent decrease in the Midwest, an 8-percent increase in the South, and a 4-percent increase in the West.
Source: U.S. Census Bureau
DEGREE-GRANTING POSTSECONDARY
Total enrollment in degree-granting institutions is expected to increase 13 percent between fall of 2015, the last year of actual data, and fall 2026.
• Enrollment in degree-granting postsecondary institutions of
students who are 18 to 24 years old is projected to increase
17 percent between 2015 and 2026.
• Enrollment in degree-granting postsecondary institutions of
students who are 25 to 34 years old is projected to increase
11 percent between 2015 and 2026.
• Enrollment in degree-granting postsecondary institutions of
students who are 35 years and older is projected to increase 4
percent between 2015 and 2026.
• Enrollment of males in degree-granting postsecondary
institutions is projected to increase 11 percent between 2015
and 2026 to 9.7 million.
• Enrollment of females in degree-granting postsecondary
institutions is projected to increase 15 percent between 2015 and 2026 to 13 million.
GROWTH BY NUMBER (2017 to 2018)
State
2018 Population
Growth
Texas
28,701,845
379,128
Florida
21,299,325
322,513
California
39,557,045
157,696
Arizona
7,171,646
122,770
North Carolina
10,383,620
112,820
Washington
7,535,591
110,159
Georgia
10,519,475
106,420
Colorado
5,695,564
79,662
South Carolina
5,084,127
62,908
Nevada
3,034,392
61,987
ENROLLMENT PROJECTIONS (In Thousands)
Year
All
pK-12
pK-12: Public
pK-12: Private
Degree-Granting Postsecondary
Total
pK-8
9-12
Total
pK-8
9-12
Total
Public
Private
2006
73,066
55,307
49,316
34,235
15,081
**5,991
**4,631
**1,360
17,759
13,180
4,579
2011
75,800
54,790
49,522
34,773
14,749
5,268
3,977
1,291
21,011
15,116
5,894
*2016
76,044
55,859
50,625
35,514
15,111
5,234
3,918
1,316
20,185
14,844
5,341
*2021
77,875
56,216
51,152
35,639
15,513
5,064
3,855
1,210
21,659
15,910
5,749
*2026
79,465
56,834
51,738
36,362
15,376
5,096
3,942
1,154
22,263
16,642
5,990
*Projected; ** Estimated
Source: National Center for Education Statistics, Projections of Education Statistics to 2026.
Note: Projections do not assume changes in policies or attitudes that may affect enrollment levels.
8 SCHOOL PLANNING & MANAGEMENT / JANUARY/FEBRUARY 2019 WEBSPM.COM
