
Page 9 - spaces4learning, Spring 2021
P. 9
2020 FACILITIES & CONSTRUCTION BRIEF spaces4learning
ENROLLMENT PROJECTIONS (In Thousands)
Year
All
pK-12
pK-12: Public
pK-12: Private
Degree-Granting Postsecondary
Total
pK-8
9-12
Total
pK-8
9-12
Total
Public
Private
2010
75,886
54,867
49,484
34,625
14,860
5,382
4,084
1,299
21,019
13,703
4,379
2017
76,184
56,406
49,484
35,496
15,190
5,720
4,252
1,468
19,788
13,113
3,660
2020*
76,112
56,368
50,654
35,293
15,361
5,714
4,183
1,531
19,744
13,118
3,575
2029**
76,921
56,806
51,068
35,987
15,081
5,738
4,281
1,457
20,115
13,375
3,628
*Estimated. **Projected.
Source: National Center for Education Statistics, Enrollment in elementary, secondary, and degree-granting postsecondary institutions, by level and control of
institution, enrollment level, and attendance status and sex of student: Selected years, fall 1990 through fall 2029.
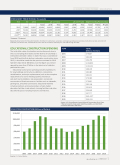
EDUCATIONAL CONSTRUCTION SPENDING
The total dollar value of education construction work done in the U.S. (including all 50 states and the District of Columbia) is estimated to be $104.5 billion in 2020. That was a small decline from 2019 (and the first decline in education construction since 2013). It should be noted that the previous estimate for 2019 had been reported at $98 billion, but that figure was revised upward by more than $7 billion in the latest set of statistics published this year.
Educational construction spending includes expenditures for new buildings and structures, additions, renovations, rehabilitations, and major replacements (such as the complete replacement of a roof or heating system); mechanical
and electrical installations; site preparation; and outside construction of fixed structures or facilities such as sidewalks, parking lots, and utility connections. Educational facilities include preschools, primary/secondary schools, higher education facilities, trade schools, training facilities, and other educational spaces including museums and libraries.
YEAR TOTAL
(Millions of Dollars)
2005 $ 79,687
2006 $ 84,928
2007 $ 96,758
2008 $ 104,890
2009 $ 103,202
2010 $ 88,405
2011 $ 84,985
2012 $ 84,672
2013 $ 79,060
2014 $ 79,681
2015 $ 85,346
2016 $ 91,629
2017 $ 96,685
2018 $ 97,777
2019 $105,374*
2020 $104,519
Source: U.S. Census Bureau, Annual Value of Construction Put in Place. * Revised using the most recent statistics available, as of April 2021. Previously reported at $98 billion.
EDUCATION CONSTRUCTION (Millions of Dollars)
$110,000 $100,000 $90,000 $80,000 $70,000 $60,000 $50,000
2005 2006 2007 2008 2009 2010 2011 2012 2013 2014 2015 2016 2017 2018 2019 2020
Source: U.S. Census Bureau
spaces4learning.com | SPRING 2021 9
