
Page 8 - spaces4learning, Spring 2021
P. 8
spaces4learning
2021 FACILITIES & CONSTRUCTION BRIEF
An Overview of the Education Construction Scene
Despite the upheaval that the public policy response to COVID-19 caused in 2020, education construction appears to have been largely unaffected for the year. According to the latest statistics, the value of constructions put in place for 2020 was essentially flat compared with the previous year and up compared with all prior years except 2008, which was a peak year. And the outlook remains strong for 2021.
However, COVID-19 responses are taking their toll, according to those who participated in our annual Facilities & Construction survey. COVID has impacted staff availability, deliveries, planning, time to completion, and many other aspects of education construction. One respondent said, “I'm an architect in Oklahoma, so I work for multiple K-12, Career Tech and higher education facilities across the state. Our biggest issue is education funding has decreased greatly. School bond projects that were going to happen in 2020 have totally stopped or moved to future years.”
Uncertainty is also a major factor. Said one higher education
respondent: “Uncertainties related to: return to full in-person instruction, new program needs, program expansions. Some uncertainty about cost of construction, but with yet-to-be-de- termined new projects, it will be a few years before we're ready to bid—we'll plan and budget prudently.” Others mentioned the uncertainty of space utilization post-pandemic and other physi- cal requirements that may come down the road as a result.
There is an upside in the near future, however. Said another PK–12 respondent: “The first quarter of 2021 will continue
to be impacted by COVID-19 safety protocols, which reduce our overall labor productivity and timely access to materials. The remainder of the year, we expect pent-up demand for construction to increase, which will begin to strain available workforce. This trend will continue into 2022 as overall workload approaches and exceeds 2018 numbers.”
The Spaces4Learning Editorial Team
CHANGES IN POPULATION AFFECT ENROLLMENT
POPULATION CHANGE
The Brookings Institute characterized population trends for
the year as “unprecedented stagnation in population growth, a continued decrease in Americans’ geographical mobility, more pronounced population aging, a first-time decline in the size of the white population, and rising racial and ethnic diversity among millennials, Gen Z, and younger groups, which now comprise a majority of the nation’s residents.”
Some stats for the year based on current estimates from the Census Bureau (as of April 2021) include:
• The total population of the United States at the end of 2020 was
330.03 million, according to the United States Census Bureau.
The population at the end of 2019 was 329.16 million. • There was roughly one death every 9.4 seconds.
• The death rate was 0.8287%.
• 377,883 deaths were ascribed to COVID-19.
• Total births may have dropped by as much as 300,000 in the
United States in 2020, largely owing to changes brought on by the pandemic, according to some estimates based on declines reported by some states.
By region, the Northwest and Midwest saw small population declines, according to first-half data for 2020 published by the U.S. Census Bureau in December 2020 (the most recent data available as of this writing). The population of the Northeast dropped from 56 million in 2019 to 55.85 million in 2020. The population of the Midwest slid from 68.34 million to 68.31 million. The South saw the greatest growth, climbing from 125.69 million to 126.66 million. The West went up from 78.3 million to 78.65 million.
Sixteen states saw population declines—including the most populous state in the nation, California, which declined by about 69,000 to 39.37 million. New York saw the largest decrease as both a percentage and a whole number. That state lost 126,355 of its population, coming in at 19.34 million.
Source: U.S. Census Bureau, Annual Estimates of the Resident Population for the United States, Regions, States, and the District of Columbia: April 1, 2010 to July 1, 2020.
ENROLLMENT PROJECTIONS
While final data are not yet available for enrollment in 2020, the National Center for Education Statistics projected that 56.4 million students would attend PreK–12 schools in fall 2020, 50.7 million of those in public schools. About 1.5 million of those are pre-kinder- garten level; 3.7 million kindergarten; 35.3 million PK–8; and 15.4 million grades 9–12. The public school enrollment projection was slightly higher than that for 2019 but lower than 2017. Public school enrollment is expected to grow slightly, to 51.1 million, between 2020 and 2029. There were an estimated 3.7 million teachers in preK–12 in the United States in fall 2020, 3.2 million of them in pub- lic schools. The projected expenditure per-pupil in the 2020–2021 school year was $14,000, with $709 billion in total expenditures.
DEGREE-GRANTING POSTSECONDARY
In higher education, 19.7 million students were projected to attend colleges and universities. Of those:
• 16.7 million were undergraduates.
• 12 million were full-time.
• 14.6 million were in public schools.
• 14 million were in four-year institutions.
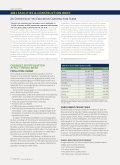
GROWTH BY NUMBER (2019 to 2020)
State
2020 Population
Growth
Texas
29,360.759
373,965
Florida
21,733,312
241,256
Arizona
7,421,401
129,558
North Carolina
10,600,823
99,439
Georgia
10,710,017
81,997
Pennsylvania
12,783,254
–15,629
Michigan
9,966,555
–18,240
California
39,368,078
–69,532
Illinois
12,587,530
–79,487
New York
19,336,776
–126,355
8 SPRING 2021 | spaces4learning.com
