
Page 7 - spaces4learning, January/February 2020
P. 7
2020 FACILITIES & CONSTRUCTION BRIEF spaces4learning
EDUCATIONAL CONSTRUCTION SPENDING
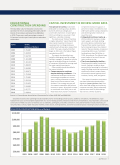
The total dollar value of education construction work done in the U.S. (including all 50 states and the District of Columbia) is estimated to be $98 billion
in 2019. There was a small percentage increase of 0.2 percent from last year’s total spent on education construction.
YEAR
TOTAL
(Millions of Dollars)
2005
$ 79,687
2006
$ 84,928
2007
$ 96,758
2008
$ 104,890
2009
$ 103,202
2010
$ 88,405
2011
$ 84,985
2012
$ 84,672
2013
$ 79,060
2014
$ 79,681
2015
$ 85,346
2016
$ 91,629
2017
$ 96,685
2018
$ 97,777
2019
$ 98,014
Source: U.S. Census Bureau, Annual Value of Construction Put in Place: 2002-2007 and 2008-2018
mary/secondary schools, higher educa
Educational construction spending includes expenditures for new buildings and structures, additions, renovations, rehabilitations, major replacements (such as the complete replacement of a roof or heating system); mechanical and electrical installations; site preparation, and outside construction of fixed structures or facilities such as sidewalks, parking lots, and utility connections. Educational facilities include preschools, pri-
EDUCATIONAL CONSTRUCTION
tio
nfa
cili
ties
,tr
ad
e
sch
inin
gf
acil
,a
ca
2005 2006 2007 2008 2009 2010 2011 2012 2013 2014 2015 2016 2017 2018 2019
EDUCATION CONSTRUCTION (Millions of D\[oMllaris)llions of Dollars\] $110,000
$100,000 $90,000 $80,000 $70,000 $60,000 $50,000
ools
tio
nal
spaces including museums and libraries.
, tra
ities
nd
oth
ere
du
Source: U.S. Census Bureau
CAPITAL INVESTMENT IN REVIEW: MORE DATA
T investment dedicated to existing campus facilities by North American colleges and universities reached an 11-year high in 2017, according to a new report from Sightlines, a Gordian company.
The sixth annual “State of Facilities in Higher Education” report found that total capital investment into exist-
ing properties on college campuses reached nearly $5 per gross square foot in 2017. This caps a steady climb that began in 2011 and is the highest figure recorded since 2007.
The report also identified a po- tentially challenging trend for college facilities managers. A deep dive into the ages of existing buildings on hundreds of campuses indicated the coming need for major capital investments.
Other notable trends identified in the report included:
• Campus expansion continues
despite declining enrollment —The educational landscape has become increasingly competitive in recent years, causing institutions to double down on the construction of new facilities. This strategy may pay off for research institutions (14 percent increase in space, 16 percent increase in enrollment since 2007), but it will likely leave many masters institutions
(17 percent increase in space, 4.5 percent increase in enrollment since 2007) with swollen campus footprints and declining tuition revenues to cover the costs.
• College debt continues to pile up — With enrollment revenues, endow- ment support, and state funding
all on the decline, institutions have financed their capital investments
by borrowing money at low interest rates for the past decade, compound- ing existing debt issues. Total debt funding (more than $41 billion in 2016, according to The Atlantic) may prove harder to service if interest rates continue to rise.
• There’s no stopping the backlog — Despite positive capital investment trends, funding is unable to keep pace with the mounting list of project needs. Backlogs continue to grow and significantly impact campus opera- tions and the overall experience of students, faculty, staff, and guests.
The report is based on comprehen- sive data collected and analyzed by Sightlines (www.sightlines.com) from more than 360 college and university campuses annually, which collectively operate more than 52,000 buildings that serve 3.5 million students.
JAN/FEB 2020 7
