
Page 6 - spaces4learning, January/February 2020
P. 6
spaces4learning
2020 FACILITIES & CONSTRUCTION BRIEF
An Overview of the Education Construction Scene
While there is much we can’t predict, there are a few things we know for sure. We know that the population of the U.S. is grow- ing and along with it the enrollment in our K-12 schools. We know that there is a growing need for an educated workforce, affecting the en- rollment of colleges and universities nationwide. We know that there is an ongoing deferred maintenance problem and a need to invest in the improvement of existing facilities. We also know that the construc- tion and renovation of educational facilities is finally on the rise.
The following information is provided to give you a brief overview
of what we know based on available data and a survey of our readers. In past reports, we’ve provided national medians on specific facility types, but this year accurate data was scarce, the sample size too small, and the project scope too varied. What you find here are the trends in population and enrollment, the trends in overall education construction spending, and the results of our reader survey—giving you an overview of the trends in facilities and construction.
The Spaces4Learning Editorial Team
CHANGES IN POPULATION AFFECT ENROLLMENT
POPULATION CHANGE
• One birth every 9 seconds
• One death every 10 seconds
• One international migrant (net) every 47 seconds • Net gain of one person every 26 seconds
States in the South and West continued to lead in population growth. Nationally, the U.S. population grew by 0.5 percent. Idaho and Nevada were the fastest-growing states, with Idaho increasing by 2.1 percent, Nevada by 1.75 percent. In addition, Arizona and Utah grew by 1.7 percent, Texas and South Carolina by 1.3 percent, and Washington by 1.2 percent. Ten states lost population last year. New York had the largest numeric decline, losing 76,790 people. Texas had the largest numeric growth over the last year, with an increase of 367,215 people.
ENROLLMENT PROJECTIONS
ELEMENTARY AND SECONDARY
Total public and private elementary and secondary school enrollment was 56.4 million in fall 2016, the last year of actual public school data. Between fall 2016 and fall 2028, an increase of just under 2 percent is expected. Public school enrollments are projected to be higher in 2028 than in 2016 for the South and West, and to lower for the Northeast and Midwest.
• Enrollment in public prekindergarten through grade 8 is
projected to decrease 1 percent between 2016 and fall 2022,
then increase by 3 percent by fall 2028.
• Enrollment in grades 9-12 is projected to increase 5 percent
between 2016 and fall 2023, then decrease by 3 percent in
fall 2028.
• Public elementary and secondary enrollment is projected
to increase 1.6 percent nationally, with some 25 states and the District of Columbia projected to have public school enrollment increases in both preK through grade 8 and grades 9 through 12. In contrast, 20 other states are projected to have enrollment decreases in both grade ranges.
Source: U.S. Census Bureau
DEGREE-GRANTING POSTSECONDARY
In fall 2017, there were 16.8 million undergraduate students and 3.0 million postbaccalaureate (graduate) students attending degree-grant- ing postsecondary institutions in the U.S. Total enrollment in degree- granting postsecondary institutions is expected to increase 13 percent between fall 2015, the last year of actual data, and fall 2026.
• Enrollment in degree-granting postsecondary institutions of students who are 18 to 24 years old is projected to increase 17 percent between 2015 and 2026.
• Enrollment in degree-granting postsecondary institutions of students who are 25 to 34 years old is projected to increase 11 percent between 2015 and 2026.
• Enrollment in degree-granting postsecondary institutions of students who are 35 years old and older is projected to increase 4 percent between 2015 and 2026.
• Enrollment of males in degree-granting postsecondary institu- tions is projected to increase 11 percent between 2015 and 2026 to 9.7 million.
• Enrollment of females in degree-granting postsecondary institu- tions is projected to increase 15 percent between 2015 and 2026 to 13 million.
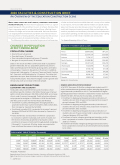
GROWTH BY NUMBER (2018 to 2019)
State
2019 Population
Growth
Texas
28,995,881
367,215
Florida
21,477,737
233,420
Arizona
7,278,717
120,693
North Carolina
10,488,084
106,469
Georgia
10,617,423
106,292
Washington
7,614,893
91,024
Colorado
5,758,736
67,449
South Carolina
5,148,714
64,558
Tennessee
6,829,174
57,543
Nevada
3,080,156
52,815
ENROLLMENT PROJECTIONS (In Thousands)
Year
All
pK-12
pK-12: Public
pK-12: Private
Degree-Granting Postsecondary
Total
pK-8
9-12
Total
pK-8
9-12
Total
Public
Private
2009
75,163
54,849
49,361
34,409
14,952
5,488
4,179
1,309
20,314
14,811
5,503
2014
76,097
55,888
50,313
35,370
14,943
5,575**
4,202**
1,373**
20,209
14,655
5,554
*2019
76,767
56,753
50,803
35,683
15,120
5,951
4,374
1,576
20,014
14,865
5,149
*2026
78,404
57,987
51,833
36,451
15,382
6,154
4,509
1,645
20,417
15,163
5,254
*Projected; **Estimated
Source: National Center for Education Statistics, Projections of Education Statistics to 2026.
Note: Projections do not assume changes in policies or attitudes that may affect enrollment levels. 6 JAN/FEB 2020
