
Page 66 - MSDN Magazine, November 2019
P. 66
TesT Run JAMES MCCAFFREY Mixture Model Clustering Using C#
Data clustering is the process of grouping data items so that simi- lar items are in the same group/cluster and dissimilar items are in different clusters. The most commonly used clustering algorithm is called k-means. The k-means approach is simple and effective, but it doesn’t always work well with a dataset that has skewed distributions.
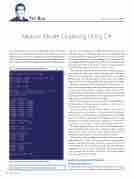
Figure 1 Mixture Model Clustering Demo Run
In this article I explain how to implement mixture model data clustering using the C# language. The best way to understand what mixture model clustering is and to see where this article is headed is to examine the demo program in Figure 1. The demo sets up a tiny dummy dataset with eight items. Each data item represents the height and width of a package of some sort. The first item is (0.2000, 0.7000) and the last item is (0.7000, 0.1000).
There are many variations of mixture model clustering. The variation presented in this article works only with numeric data and requires that the data be normalized or scaled so that all values are roughly in the same range. Normalization prevents large values, such as annual incomes, from overwhelming small values such as high school GPAs.
The demo program specifies the number of clusters as K = 3. Most clustering techniques, including mixture model clustering, require you to set the number of clusters, and this must be deter- mined by trial and error. Mixture model clustering uses a technique called expectation-maximization (EM) optimization, which is an iterative process. The demo iterates five times.
The final clustering result is contained in a matrix called mem- bership weights, w. The w matrix has eight rows. Each row of w corresponds to a row of the dataset.
The first row of w is (0.9207, 0.0793, 0.0000). Notice that the values in each row of w sum to 1.0 so they can be loosely inter- preted as the probability that the corresponding data item belongs to a cluster. Therefore, data item [0] belongs to cluster 0 because column [0] of w has the largest value. Similarly, the value of w[7] is (0.0000, 0.2750, 0.7250), so data item [7] belongs to cluster 2.
The demo program displays the values of internal data struc- tures named Nk (column sums of w), a (mixture weights), u (cluster means) and V (cluster variances). These values are used by the EM optimization algorithm part of mixture model clustering.
This article assumes you have intermediate or better program- ming skills with C#, but doesn’t assume you know anything about mixture model data clustering. The demo is coded using C#, but you shouldn’t have any trouble refactoring the code to another language such as JavaScript or Visual Basic. The complete demo code is presented in this article. The source code is also available in the accompanying download.
Understanding the Multivariate
Gaussian Distribution
Mixture model clustering and EM are really general techniques rather than specific algorithms. The key math equations for the
Code download available at msdn.com/magazine/1119magcode.
54 msdn magazine
