
Page 28 - MSDN Magazine, October 2019
P. 28
Visualization with ggplot2
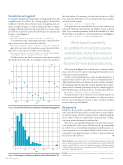
Fortunately, the ggplot2 package makes creating graphs from data straightforward, as it allows for creating graphics declaratively. Simply provide the data and instructions on mapping data col- umns to graphic elements, as well as which graph type to employ, and ggplot2 handles the rendering. For instance, to create a scatter plot of PostCount by Year, enter the following code to generate the graph as seen in Figure 1.
library(ggplot2)
ggplot(year_postcount_only, aes(Year, PostCount) ) + geom_point()
To connect the points on the graph with a line, enter the follow- ing code into a new cell and execute it, like this:
ggplot(year_postcount_only, aes(Year, PostCount) ) + geom_line() + geom_point()
ggplot2 also provides rich formatting options. Enter the follow- ing code to create a more colorful version of the line:
ggplot(year_postcount_only, aes(Year, PostCount) ) + geom_line(linetype="dashed", color="blue", size=1) + geom_point(color="red", size=2)
To further explore the data, I can generate a histogram to explore the distribution of the data. For example, I want to get an idea of
900
600
300
the distribution of how many posts there have been across all 16 years. Enter the following code to use data from the fwposts tibble to build out a histogram:
ggplot(fwposts, aes(Posts) ) + geom_histogram()
As the graph shows, most months have 50 posts or less, with one very noticeable outlier. In statistical terms, the number of posts is skewed right. To get some finer granularity, I will set the binwidth to 10. Enter the following code and run it to create the graph as shown in Figure 2:
ggplot(fwposts, aes(Posts) ) + geom_histogram(binwidth=10)
While base R is perfectly acceptable for most data science- related tasks, many R developers prefer to use the tidyverse suite of libraries for increased productivity.
The histogram in Figure 2 shows that the most common number of posts lies between 30 and 40. Adjusting the binwidth to lower values increases the granularity.
Another useful visualization for understanding distribution of numeric values is the box plot. A box plot is a standardized way of displaying the distribution of data based on a five-number summary: the minimum value, first quartile, median, third quartile and max- imum value. Fortunately, generating a box plot is simple in ggplot2. Enter the following code and execute it to see the box plot for Posts:
ggplot(fwposts, aes(x=Posts, y=Posts)) + geom_boxplot()
The generated plot shows that the first and third quartile are between around 13 and 50, with a number of outliers at or above 100. For more information about box plots, read this excellent article on the topic: bit.ly/2IbqkmX.
Wrapping Up
While base R is perfectly acceptable for most data science-related tasks, many R developers prefer to use the tidyverse suite of librar- ies for increased productivity. In this article, I walked through the most common steps in a typical data science pipeline: loading, exploring, manipulating and visualizing data.
These open source package libraries provide a developer experi- ence optimized for data science. The fluent style of programming provides better code readability, streamlined workflow, and a con- sistent experience across multiple libraries. In fact, there’s even a style guide for package developers to follow so that new libraries fit nicely into the tidyverse. n
Frank La Vigne works at Microsoft as an AI Technology Solutions Professional where he helps companies achieve more by getting the most out of their data with analytics and AI. He also co-hosts the DataDriven podcast. He blogs regularly at FranksWorld.com and you can watch him on his YouTube channel, “Frank’s World TV” (FranksWorld.TV).
Thanks to the following Microsoft technical expert for reviewing this article: David Smith
Artificially Intelligent
2004 2008 2012 2016 Year
Figure 1 Scatter Plot of PostCount by Year as Rendered by ggplot2
30
20
10
0
0 50 100 150 200 Posts
Figure 2 Histogram of Posts per Month with a Binwidth of 10 24 msdn magazine
Count PostCount
