
Page 27 - MSDN Magazine, October 2019
P. 27
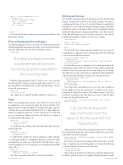
fwposts <- read_csv("franksworldposts.csv", col_types = cols(
Month = col_date(format = "%b-%y"), Posts = col_integer(),
`Days in Month` = col_integer(), PPD = col_double()
)
fwposts
Note that the Month column is now properly marked as a date field in the schema.
Filter and Manipulate Data with dplyr
The dplyr package provides a consistent set of functions for nearly all data manipulation and querying tasks. To use the dplyr package, enter the following code into a new cell and execute it:
library(dplyr)
The dplyr package provides a consistent set of functions for nearly all data manipulation and querying tasks.
With the dplyr package loaded, I will use it to view only the months with 100 or more posts by using the pipe operator %>% to pass the tibble to the filter method. Enter the following code into a new cell and execute it:
fwposts %>% filter(Posts >= 100)
The output shows only the months with 100 or more posts.
Pipes
Pipes are a fundamental concept to the tidyverse. They’re used to emphasize a series of actions where the item to the left of the pipe operator becomes the input to the right of the pipe operator. Software developers familiar with fluent style of coding will imme- diately recognize this pattern. To view only those rows with 100 posts or more in ascending order based on the Posts column, I would write the following code:
fwposts %>%
filter(Posts >= 100) %>%
arrange(desc(Posts))
To see them in descending order, I would add a call to the desc method, like this:
fwposts %>%
filter(Posts >= 100) %>%
arrange(desc(Posts))
I could further analyze the data by adding an additional pipe to a summarize function. Summarize functions create one value summarizing the values in a table. Enter the following code to view the number of rows, the mean post count and the mean PPD values, like so:
fwposts %>% arrange(desc(Posts)) %>%
summarize(n(), mean(Posts), mean(PPD))
The values returned will be 183, 36.94536 and 1.215148.
Working with Groups
Note that the summarize function returned one value for the entire dataset. If I wanted to track how the values changed over time, I could group the values by year. To do this, I’ll import a new library (lubridate) to extract the year from the Month column. The lubri- date library makes working date values easier. Using dplyr’s mutate method,IwilladdanewcolumnnamedYeartostoretheextracted value. The following code does just that, assigns it to the fwposts variable and displays it. Take note of the new column:
library(lubridate)
fwposts <- fwposts %>%
mutate(Year = lubridate::year(Month))
fwposts
Now that the Year column has been added, I can use group by it and display a summary based on the group. Enter the following code into a new cell and execute it:
posts_by_year_summary = fwposts %>% group_by(Year) %>%
summarize(PostCount=n(), AvgPosts = mean(Posts), AvgPPD = mean(PPD)) posts_by_year_summary
Note that there are now summary rows for each year and that the columns have names. However, the PostCount column contains the number of rows in a given year, not the sum of the posts. To change this, I’ll need to use the sum function to add up the values in the Posts column. Enter the following code into a new cell and execute it:
posts_by_year_summary = fwposts %>% group_by(Year) %>%
summarize(Records= n(), PostCount=sum(Posts), AvgPosts = mean(Posts), AvgPPD = mean(PPD))
posts_by_year_summary
Now I have the total number of posts for the year, in addition to the number of rows for a given year, stored in posts_by_year_ summary. If I wanted to remove all columns except for the Year and PostCount, I’d use the select function to choose only the fields I wanted to keep. Here’s the code:
year_postcount_only <- select(posts_by_year_summary, Year, PostCount) year_postcount_only
I can use the arrange and
desc methods to sort the values to find the year with the highest posts.
Alternatively, I could use the select function to remove columns. Execute the following code (the contents of the year_postcount_ only tibble should be identical):
year_postcount_only <- select(posts_by_year_summary, -c(Records, AvgPosts, AvgPPD)) year_postcount_only
Just as before, I can use the arrange and desc methods to sort the values to find the year with the highest posts. Enter the following code into a blank cell and execute it, like this:
year_postcount_only %>% arrange(desc(PostCount))
The results show that 2017 was a busy year on the blog. The next step would be to plot these values onto a graph and explore the data visually.
)
msdnmagazine.com
October 2019 23
