Page 39 - MSDN Magazine, June 2018
P. 39
Count) that will be reported in differently named events. This will be important in the analytics as we look at specific metrics and then view them by operation or event. As shown in Figure 5, first we ingest multiple data files, then consolidate and transform them, and finally write to two target locations. The fully prepared data set is persisted to long-term Blob Storage and an aggregated subset is sent to our RDBMS, Azure SQL Database. Of course, within each high-level step there are several sub-steps. Specifically, we import four distinct files, merge them into a single Spark DataFrame, and write the raw, consolidated dataset to Blob Storage. The consolidated data is then read back out of Blob storage into a new DataFrame for cleansing and transformation. To complete the transformation, we subset the DataFrame (that is, narrow it to relevant columns only), rename the columns to meaningful names, and replace null values in the Servicer Name column. The final form of the data is persisted in the Parquet file format. The last step in this example persists the data to an Azure SQL Database.
For this Azure Databricks job example, we've taken the single notebook approach with the steps programmed in separate code cells. One parent operation Id is set for each run of the job. A (child) operation Id applies to each operation within the job, and we’ve defined Acquisition, Transformation and Persistence as these operations. We track the events occurring for each operation, recording timestamp, record count, duration and other parame- ters in Application Insights at job runtime.
As in the earlier predictions example, we add the Python pack- age “applicationinsights” to the cluster, run the setup notebook, and instantiate a new instance of the TelemetryClient object. This time we'll name the instance DataEngineeringExample and then
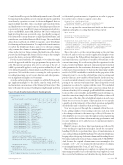
Figure 6 Data Transformation Event-Tracking Code
set the initial operation name to Acquisition, in order to prepare for our first series of steps to acquire source data:
telemetryClient = NewTelemetryClient( "DataEngineeringExample", operationId, parentOperationId)
telemetryClient.context.operation.name = "Acquisition"
Next, we capture the current time and track our first event in Application Insights, recording that the job has started:
import datetime
jobStartTime = datetime.datetime.now() jobStartTimeStr = str(jobStartTime)
telemetryClient.track_event('Start Job', { 'Start Time': jobStartTimeStr, 'perfDataFilePath':perfDataFilePath, 'perfDataFileNamePrefix' : perfDataFileNamePrefix, 'consolidatedDataPath':consolidatedDataPath, 'transformedFilePath' : transformedFilePath, 'perfDBConnectionString': perfDBConnectionString, 'perfDBTableName': perfDBTableName})
telemetryClient.flush()
This is the code to set the current timestamp as the start time for the job, and record it in our first Application Insights event. First, we import the Python library datetime for convenient date and time functions, and then set variable jobStartTime to the current timestamp. It’s worth noting that the signature for the track_event([eventName], [{props}], [{measurements}]) method takes parameters for the event name, dictionary of properties, and a dictionary of measurements. To that end, the timestamp variable needs to be JSON-serializable to include it in the properties of the telemetry event. So, we cast the jobStartTime object as a string and put the value in a new variable jobStartTimeStr. In the next step, we send our initial telemetry event with the track_event method, passing it our custom event name Start Time along with several parameters we selected to capture with this event. We've included parameters for various file paths and connection strings that are referenced in the job. For example, perfDataFilePath contains the location of the source data files, and perfDBConnectionString con- tains the connection string for the Azure SQL Database, where we'll persist some of the data. This is helpful information in such cases where we see a 0 record connect or have an alert set; we can take a quick look at the telemetry of the related operation and quickly check the files and/or databases that are being accessed.
Now we can proceed through the command cells in the note- book, adding similar event-tracking code into each step, with a few changes relevant to the inner steps of the job. Because it's often helpful to use record counts throughout a data-engineering job to consider data volume when monitoring performance and resource utilization, we've added a record count measurement to each tracked event.
Figure 6 shows a few basic data transformations, followed by event-tracking for Application Insights. Inside the exception- handling Try block, we perform three types of transformations at once on the perfTransformDF DataFrame. We subset the DataFrame, keeping only a select group of relevant columns and discarding the rest. We replace nulls in the Servicer Name column with “UNKNOWN.” And, because the original column names were meaningless (for example,“_C0,”“_C1”),werenametherelevantsubsetofcolumns to meaningful names like “loan_id” and “loan_age.”
Once the transformations are complete, we capture the current timestamp in variable “end” as the time this step completed; count the rows in the DataFrame; and calculate the step duration based
if notebookError == "": try:
perfTransformedDF = perfTransformedDF['_c0','_c1','_C2','_C3','_C4', \ '_C5','_C6','_C7','_C8','_C9', \
'_C10','_C11','_C12','_C13'] \
.fillna({'_C2':'UNKNOWN'}) \ .withColumnRenamed("_C0", "loan_id") \ .withColumnRenamed("_C1", "period") \ .withColumnRenamed("_C2", "servicer_name") \ .withColumnRenamed("_C3", "new_int_rt") \ .withColumnRenamed("_C4", "act_endg_upb") \ .withColumnRenamed("_C5", "loan_age") \ .withColumnRenamed("_C6", "mths_remng") \ .withColumnRenamed("_C7", "aj_mths_remng") \ .withColumnRenamed("_C8", "dt_matr") \ .withColumnRenamed("_C9", "cd_msa") \ .withColumnRenamed("_C10", "delq_sts") \ .withColumnRenamed("_C11", "flag_mod") \ .withColumnRenamed("_C12", "cd_zero_bal") \ .withColumnRenamed("_C13", "dt_zero_bal")
print("nulls replaced")
end = datetime.datetime.now()
rowCount = perfTransformedDF.count()
duration = round((end - start).total_seconds(), 1) telemetryClient.track_event('Transformation Complete', {}, \
telemetryClient.flush() except Exception as e:
notebookError = str(e)
{ 'Records Transformed': rowCount, \ 'Transformation Duration':duration })
telemetryClient.track_exception(e,{"action":"column transform"},{}) else:
print("command skipped due to previous error")
msdnmagazine.com
June 2018 33


