
Page 38 - MSDN Magazine, June 2018
P. 38
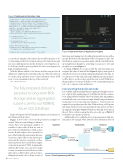
Figure 3 Notebook Initialization Code
baseRatingsFile = dbutils.widgets.get("baseRatingsFile") newRatingsFile = dbutils.widgets.get("newRatingsFile") trainOperationId = dbutils.widgets.get("trainOperationId") parentOperationId = dbutils.widgets.get("parentOperationId") maxIterations = int(dbutils.widgets.get("maxIterations")) numFolds = int(dbutils.widgets.get("numFolds")) numUserRecommendations = int(
dbutils.widgets.get("numUserRecommendations")) predictionFilePath = dbutils.widgets.get("predictionFilePath")
if trainOperationId == "": trainOperationId = NewCorrelationId()
if parentOperationId == "": parentOperationId = NewCorrelationId()
#setup other needed variables
telemetryClient = NewTelemetryClient("PredictionExample",
trainOperationId, parentOperationId) telemetryClient.context.operation.name = "Train Model"
you needed to initialize other values, this would be the place to do it. Separating out the factory function keeps the clutter down and also eases implementation for the developer converting the note- book from a sandbox prototype kind of code to an enterprise job kind of implementation.
With the library added to the cluster and the setup notebook defined, we simply need to add a line at the top of the job notebook to run the setup and then create a starter telemetry object. We’ll issue a %run command at the top of the notebook:
%run ./AppInsightsSetup
The fully prepared data set is persisted to long-term Blob Storage and an aggregated subset is sent to our RDBMS, Azure SQL Database.
In the subsequent cell we’ll simply instantiate a new instance of the TelemetryClient object.
Figure 3 shows the code from the prediction example we created. There are several things to take note
Figure 4 Operation Name in Application Insights
functions and running tests by calling the parent function with a specific ID. Both work sufficiently well for our purposes here. The last thing we assign is an operation name, which eventually shows up in Application Insights as something you can use to view and group by, as seen in Figure 4.
Looking at Figure 3, you can see that the operation name was assigned the value of Train Model. Figure 4 depicts it in a grid of data after it was chosen as the grouping mechanism for the data. As we run more jobs through and assign differing operation names, we’ll be able to see those show up in the view, as well. With those things in place, we’re in good shape to work on instrumenting our job code to capture events and metrics.
Instrumenting Databricks Job Code
Let's walk through an example that uses Application Insights to mon- itor a typical data-engineering job in Databricks. In this scenario, we’re using publicly available data from Fannie Mae (bit.ly/2AhL5sS) and will take raw source data on single-family loan performance and prepare it for reporting and analytics. Several steps are required to properly prepare the data. With each step, we’ll capture information like record count and elapsed time and record these in Application Insights. Figure 5 illustrates the high-level steps in the job. We’ve settled on using the titles across the top of Figure 5 to identify our separate operations.
Additionally, we’ve established a set of measurements with sim- ilar names (for example, Write Duration, Read Duration, Record
of here. First, we’re passing in a number of variables to the notebook that are sent as part of the job initialization, which is done via the dbutils.widgets object provided as part of the Databricks environment. Because we need a couple of IDs for the parent oper- ation and the discrete operation, we’ll go ahead and check those and, if they’re empty, create and assign new UUIDs. Assigning the arbitrary IDs in this case is mostly to make it easier to run interactively. However, other approaches could be taken, such as encapsu- lating the job notebook’s code into a series of
Acquisition
Acquire and Consolidate
Transformation
Schematize and Clean
Filter and Aggregate
Persist to Long-term Store
Persistence
Persist to RDBMS
32 msdn magazine
Azure Databricks
Source Data
Figure 5 Data Engineering Job Flow
