
Page 42 - MSDN Magazine, April 2018
P. 42
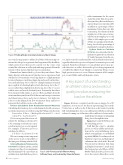
Figure 9 Finding Peaks in Accelerometer and Gyro Values
are several components to athletic load. One of the most import- ant involves the g-forces generated and experienced by the athlete, which creates forces they need to control over the course of an activity like a ski turn, as well as jerks and snaps generated from the terrain or their motion that they must accommodate.
Humans have limits related to g-forces they can tolerate. These limits depend on the amount of time the stress is experienced and whether it’s a low intensity over a long duration or a high intensity for short durations. And these limits depend as well on the direc- tion in which that g-force is felt. For example, humans are much more capable of tolerating high vertical-direction g-force (the “z” access) rather than a high lateral-direction g-force (the “y” access) with its stress on the neck, back and joints. Fortunately, there have been extensive field studies of g-force effects and limits from the aviation industry and from NASA that we can leverage to measure and characterize g-force and g-force tolerances. Let’s delve into g-forces on the human body, how we measure them, and how to represent the load they create on the athlete.
G-Force Calculations from Acceleration Sensor Measures
Calculating directionless g-force on the human body with our sensor acceleration measures is as follows using the Pythagorean theorem: Directionless G-Force = Math.sqrt(AccelerationX^2 + Accel-
reflect maximums for the center of gravity, rather than for a partic- ular joint, they offer a useful way to express the g-forces experienced by an athlete as a percentage of these maximums. Given that we’re able to measure g-force durations at the sample rate of the sensor, in any- where from 10 samples per second (10hz) to 100 samples per second (100hz), we can characterize the ath- lete’s g-force load as a percentage of maximum for any given duration.
Python Code to Calculate G-Forces As noted earlier, the for- mula just requires the Acceleration X, Y and Z measures from the sen-
sor. And you need to understand the scale in which it’s measured, typically either in feet per second squared or in meters per second squared. From these elements, we can calculate g-force in a spe- cific direction, as well as directionless g-force being experienced overall by the athlete’s body. Thanks to our partner XSens, we use high-precision sensors to record data movements at 100 samples per second (100hz) and load them into Azure.
A key aspect of understanding an athlete’s stress and workout quality involves measuring the load on the athlete.
Figure 10 shows a capture from the sensors mapped to a 3D animation. As you can see, the skier is experiencing g-force in the Y-direction, as well as in the X-direction as he travels down the hill. Calculating these forces, in combination with the acceleration achieved coming out of that turn, allows athletes to better under-
erationY^2 + AccelerationZ^2)
G-force in a given direction is cal- culated by dividing acceleration by 9.81, assuming acceleration is mea- sured in meters per second squared. For example, Y-direction g-force is calculated as follows:
Y G-Force = AccelerationY / 9.81
Of course, an important component of the g-force load on the athlete is the time period during which it’s felt.
G-Force Maximum Tolerances by Duration For athletic activity, a useful comparison is the g-force maximums that the human body can tolerate in each direction. And while these g-forces
Figure 10 G-Force Load Is Different Along Different Axes, as Visualized by XSens Software
stand their performance at navigating that g-force through the turn.
Figure 11 presents the Python code for calculating g-force.
You’ll find the script to calculate g-force, as well as additional calcula- tions in the script including g-force relative to maximums, on our GitHub rep at bit.ly/2BPS6nA. To read more about the physics of g-forces, and their impact on humans, take a look at the “Beyond Velocity and Acceleration: Jerk, Snap and Higher Derivatives” article from the European Journal of Physics at bit.ly/ 2FvLkTD, which describes g-forces rela- tive to the context of the roller-coaster
36 msdn magazine
Machine Learning
