
Page 40 - MSDN Magazine, April 2018
P. 40
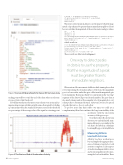
Figure 7 Cosmos DB Query Results for Sensor Kit Summary Data
ending point will be toward the end of the data where accelerom- eter goes below that threshold.
It’s well known that accelerometer sensor data is very noisy, and us- ing a moving average calculation yields a smoother signal. Let’s define a point in time when the standard deviation exceeds the threshold as a percentage of the average value of the signal as a starting point:
a_smooth1 <- SlidingAvg(a,lag,threshold,influence) st<-which(a_smooth1$std > thresholdPct* a_smooth1$avg) startPos<-min(st)
endPos<-max(st)
One way to detect peaks in data is to use the property that the mag- nitude of a peak must be greater than its immediate neighbors. Here’s how we calculate the magnitude of the accelerometer and gyro values:
lag <- 30
threshold <- 1.5
influence <- 0.5 res<-SmoothAndFindPeaks(df$magnitudeW,df$magnitudeA,lag,threshold,influence) print (paste("Total peaks in A = ", length(res$pks_a), " peaks in W = ", length(res$pks_w) ))
which results in:
> res<-SmoothAndFindPeaks(df$magnitudeW,df$magnitudeA,lag,threshold,influence) [1] "Calculation for activity start = 3396 end = 4239"
> print (paste("Total peaks in A = ”, length(res$pks_a), " peaks in W = ", length(res$pks_w) ))
[1] "Total peaks in A = 29 peaks in W = 22"
These results are illustrated in Figure 9.
One way to detect peaks in data is to use the property that the magnitude of a peak must be greater than its immediate neighbors.
Observation of the movement of athletes while turning shows that every time during the transition phase of the turn, the magnitude goes to a lower value, and at the apex of the turn the magnitude gets to its maximum. This means that if we count peaks in the “moving” segment of the data we’ll get our desired number. The gyro data is also much cleaner and we’ll use angular velocity magnitude to cal- culate peaks to determine the turns. Afterward, we need to get rid of peaks that are too close to each other.
To get low noise data that’s stable over time, we could use a complementary filter that combines the long-term stability of the accelerator with the short-term
accuracy of the gyroscope.
Now that we have R code for turn detection, we can build an ML train- ing model in a process similar to the one that’s described in a Machine Learning Blog post at bit.ly/2EPosSa.
Measuring Athlete
Load with G-Forces
Athletic load in a workout goes beyond simply the aggregate mea- sures of distance traveled or total activities completed. A key aspect of understanding an athlete’s stress and workout quality involves mea- suring the load on the athlete. There
Machine Learning
Figure 8 The Start and End of Acceleration Activity 34 msdn magazine
