
Page 24 - MSDN Magazine, April 2018
P. 24
Exploring Data with DataFrames
DataFrames expose multiple ways to explore data. For instance, to view the shape of the data, enter the following code into a blank cell and then execute the code:
recordCount = flights_df.count()
column_count = len(flights_df.columns)
print ("DataFrame has " + str(recordCount) + "rows and " + str(
column_count) + " columns.")
The resulting response will read:
DataFrame has 503897 rows and 26 columns.
The heavy lifting to parallelize the execution of the data queries is done by the Spark core engine.
To view only the flights leaving BWI airport, enter the following into an empty cell and execute:
flights_leaving_BWI = flights_df.where(flights_df.ORIGIN == 'BWI') flights_leaving_BWI.show()
The code created a new DataFrame in the flights_leaving_BWI with results filtered from the flights_df DataFrame. The show method displays the top 20 rows. The results may look a bit dis- organized due to the nature of the formatting constraints of the Web page and the DataFrame containing 26 columns. Right now,
I just want to see the airline carrier, flight number, day of month and flight destination. To do this, modify the code in the cell to the following and execute again:
flights_leaving_BWI = flights_df.where(flights_df.ORIGIN == 'BWI'). select("UNIQUE_CARRIER",
"FL_NUM", "TAIL_NUM", "DAY_OF_MONTH", "DEST") flights_leaving_BWI.show()
The formatting will look better as there are only five columns returned and will fit better onto the Web page. What if you wanted to sort the results by flight destination and show the first 100 rows as opposed to the first 20? Change the code in the cell to the following to do just that:
flights_leaving_BWI = flights_df.where(flights_df.ORIGIN == 'BWI'). select("UNIQUE_CARRIER",
"FL_NUM", "TAIL_NUM", "DAY_OF_MONTH", "DEST").sort("DEST") flights_leaving_BWI.show(100)
What if you wanted to create a DataFrame of all the flights departing the DC area’s three major airports? To do that, enter the following code into a new cell and execute:
flights_leaving_DCmetro = flights_df.where( (flights_df.ORIGIN == 'BWI') | (flights_df.ORIGIN == 'DCA') | (flights_df.ORIGIN == 'IAD') ).select( "UNIQUE_CARRIER", "FL_NUM", "TAIL_NUM", "DAY_OF_MONTH", "ORIGIN", "DEST")
flights_leaving_DCmetro.show()
Note that I added the origin field into this DataFrame to show from where a flight originated.
Create a new cell, enter the following code and execute it:
print ("Flights leaving BWI: " + str(flights_leaving_BWI.count()))
print ("Flights leaving DC Metro: " + str(flights_leaving_DCmetro.count()))
The results returned should look something like this:
Figure 4 Creating a New Folder in the Blob Container Created for the Spark Cluster
Flights leaving BWI: 8422 Flights leaving DC Metro: 18502
As you can see, working with Data- Frames is intuitive and simple. The heavy lifting to parallelize the execution of the data queries is done by the Spark core engine. Additionally, anyone familiar with Hive or Pig will notice that execu- tion time on these queries is significantly faster in Spark.
Creating a Predictive
Model with SparkML
To create a predictive model with Spark ML, I need to import some libraries into my project. To do this, create a new cell, enter the follow- ing code, and execute it:
from pyspark.sql.types import * from pyspark.sql.functions import *
from pyspark.ml import Pipeline from pyspark.ml.feature import VectorAssembler
from pyspark.ml.classification import LogisticRegression
Next, I need to create a new DataFrame with just the fields I need to create a predictive model of the likelihood of a flight being delayed. The following code pares down the original 26 columns in
Artificially Intelligent
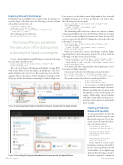
Figure 5 Launching the Jupyter Notebooks Environment for the Spark Cluster 18 msdn magazine
