
Page 70 - MSDN Magazine, November 2017
P. 70
TesT Run JAMES MCCAFFREY Kernel Logistic Regression Using C#
Kernel logistic regression (KLR) is a machine learning technique that can be used to make binary predictions. For example, KLR could predict if a person will repay a loan (fail to repay = 0, successfully repay = 1) based on predictor variables such as age, income and existing debt amount. KLR is an advanced variation of ordinary logistic regression.
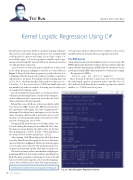
A good way to see where this article is headed is to take a look at the demo program in Figure 1 and the associated data in Figure 2. The goal of the demo program is to predict the class, 0 or 1, of dummy data that has just two predictor variables (sometimes called features), x0 and x1. For example, the first training data item is (2.0, 3.0, 0), which means that if the predictor values are x0 = 2.0 and x1 = 3.0, the correct class is 0. KLR can handle data with any number of predictor variables, but using just two allows you to visualize the technique easily.
The 21 training data points have a circular geometry, which means that simple linear classification techniques, such as ordinary logistic regression, are ineffective. Such data is called non-linearly separable.
Behind the scenes, KLR uses a function called a radial basis function (RBF) kernel. The RBF kernel function has a parameter called sigma. The value of sigma must be determined by trial and error, and sigma is set to 1.0 in the demo. Training a KLR model is an iterative process and the demo sets the maximum number of iterations to 1,000, and sets a learning rate, eta, to 0.001.
Training a KLR model creates a set of “alpha values,” one for each training data item, plus an additional “bias” value. The demo program displays the alpha values for the first three training items (-0.3071, -0.3043, -0.3071) and the last two items (0.8999, 0.6108) and the bias (-1.0722).
After training, the KLR model predicts all 21 data items correctly. Then the model is applied to four test data items, shown as black dots in Figure 2. The first test item has inputs (1.5, 4.5) and a correct class of 0. The prediction model cor- rectly predicts that item, and the other three test items, too.
This article assumes you have intermediate or higher pro- gramming skills but doesn’t assume you know anything about KLR. The demo program is coded using C#, but you should have no trouble refactoring the code to another language, such as Java or Python, if you wish. The demo program is
too long to present in its entirety, but the complete source code is available in the file download that accompanies this article.
The RBF Kernel
A kernel function measures the similarity of two vectors or arrays. The RBF kernel function I mentioned earlier is the most common, and is the type used by the demo program. An RBF value of 1.0 means two vectors are identical. Smaller RBF values indicate two vectors are less similar.
The equation for RBF is: K(v1,v2)=exp(-||v1-v2||^2/(2*sigma^2))
Here, K stands for kernel; v1 and v2 are two vectors that have the same length; sigma is a parameter with a value like 1.0 or 1.5; the || indicates Euclidean distance; and the exp function is Euler’s number (e = 2.71828) raised to a power.
Code download available at msdn.com/magazine/1117magcode.
66 msdn magazine
Figure 1 Kernel Logistic Regression Demo
