
Page 38 - MSDN Magazine, November 2017
P. 38
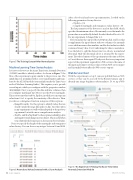
Figure 5 The Training Dataset After Normalization
Machine Learning Time-Series Analysis
Let’s now see how to use the Azure Time Series Anomaly Detection (ATSAD) module to identify outliers. As shown in Figure 7, the flow of the experiment is quite similar to the previous one. The initial dataset is normalized with z-score transformation and trans- ferred to the ATSAD module (you can find it under the Time Series node of Machine Learning Studio). This requires you to provide several inputs, which you configure with the properties window (bit.ly/2xUGTg2). First, you specify the data and time columns, then you configure martingale type. Here, I use the Power martingale. This activates another textbox, Epsilon, in which you can type any value from 0 to 1 to specify the sensitivity of the detector. Then, you choose a strangeness function, using one of three options:
• RangePercentile: Use this option to identify values that are clearly outside the range, like spikes or dips. I use this option in my experiment so it will work analogously to the previous experiment, but with a more comprehensive analysis.
• SlowPos-andSlowNegTrend:Usetheseoptionstoidentifypositive and negative trend changes in your dataset. This is useful when your solution looks for increases or decreases in observed values.
Next, you specify the length of the martingale and strangeness values history. You can choose any integer between 10 and 1000.
Figure 6 Anomalous Values Detected with z-Score Analysis 34 msdn magazine
After a bit of trial-and-error experimentation, I settled on the following parameters for my detector:
• Epsilon = 0.4
• Length of martingale and strangeness values history = 50 The last parameter of the detector is an alert threshold, which specifies the minimum value of the anomaly score that marks the given value as an outlier. By default, the alert threshold is set to 3.5.
For my experiment, I changed this to 2.
If you visualize the output of the ATSAD module, you’ll see that
it supplements the input dataset with two columns: the anomaly score, which measures abnormalities, and the alert indicator, which contains a binary value (0 or 1) indicating if a value is anomalous. I use the latter to split the dataset into two subsets: normal and abnormal. Only the abnormal subset is returned by the experi- ment. The other elements of the experiment are the same as before so I won’t discuss them again. I’ll only note that a very important aspect of the experiment required for a Web service is the name of the input and output. I set these values to Data (Web service input) and AnomalyDetectionResult (Web service output).
Web Service Client
With the experiments set up I can now publish them as Web services so they can be accessed by the RemoteCamera app to identify any image brightness abnormalities. To set up a Web
Figure 7 An Experiment Utilizing the Azure Time Series Anomaly Detection Module
Machine Learning
