
Page 36 - MSDN Magazine, November 2017
P. 36
event handler in the MainPage.xaml.cs in the accompanying code). AddTrainingValue proceeds as follows: First, I create an instance of the BrightnessDataPoint, which is then added to the collection. When this collection has 100 items, I save it to the CSV file. I then fire the TrainingDataReady event, which is handled in MainPage to break
training-dataset acquisition and display the file location in the UI:
private async void AnomalyDetector_TrainingDataReady( object sender, TrainingDataReadyEventArgs e)
{
await ThreadHelper.InvokeOnMainThread(() => {
remoteCameraViewModel.IsTrainingActive = false;
remoteCameraViewModel.TrainingDataSetFilePath = e.FilePath; });
}
The location of the training dataset is displayed in the textbox, so you can easily copy it and paste it in Windows Explorer to see the resulting data.
The z-Score Analysis
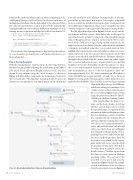
With the training dataset ready, I prepare the first experiment in Machine Learning Studio, following the instructions in McCaffrey’s 2014 article. I first upload the BrightnessData.csv file, and then design the experiment using the visual designer, as shown in Figure 4. Briefly, all the components are in the menu, located on the left-hand side of the Machine Learning Studio. To place an element in your experiment, you simply drag it on the experiment
pane (the center part of the Machine Learning Studio). Each com- ponent has specific inputs and outputs. You connect compatible nodes to control the data flow between modules. Components can have additional configuration, which you set using the properties window (it appears on the right of the Machine Learning Studio).
The ML algorithm depicted in Figure 4 works in two modes: experiment and Web service. They differ only in the input. In experiment mode, an input is composed of the uploaded training dataset (BrightnessData), which is replaced in the Web service mode by the Web service input. Independent of the mode, the input is converted to a dataset, then the values from the brightness column are normalized using the z-score transformation (bit.ly/ 2eWwHAa). The transformation converts brightness values to z-scores, which tell you how far the current value is from the mean. This distance is measured in standard deviations. The larger a distance, the higher the probability that the current value is an outlier. I apply the z-score normalization because, in general, the base or normal brightness level varies depending on what the camera sees. Thus, the z-score transformation ensures the correct brightness level, after normalization is close to 0. The raw brightness values vary from approximately 40 to 150. After normalization, all brightness values will fall between approximately -4.0 and +4.0, as shown in Figure 5. Consequently, to find anomalous values all I need to do is apply the threshold filter. Here, I use the Azure Machine Learning
Threshold Filter of type OutOfRange with lower and upper boundaries set to -2 and 1.5. I choose these values based on the z-scores plot in Figure 5 and set them using the properties pad of the Thresh- old Filter in Machine Learning Studio.
After thresholding, the dataset con- tains one Boolean column, specifying whether a given time point is outside the specified range. To supplement this information with actual brightness values that are identified as outliers, I combine this column with the original dataset and then split the resulting dataset into two subsets: one containing anomalous values only and the other with normal values (see the bottom part of Figure 4). I change the column datatype before splitting because the Split Data module doesn’t accept Boolean values. Then, the first subset is returned by the experi- ment. In the Web service view, this result is transferred to the client. Note that to see values from any dataset you use the Results dataset | Visualize option from the dataset context menu in Machine Learning Studio. This option works provided you’ve previously run the experiment. Figure 6 depicts an example of such visualization of the last dataset from the experiment shown in Figure 4.
Machine Learning
Figure 4 Anomaly Detection Using z-Score Analysis 32 msdn magazine
