
Page 69 - MSDN Magazine, October 2017
P. 69
During training, the demo displays the mean squared error between predicted output values and correct output values, every 2,000 iterations. Training error is difficult to interpret and is mon- itored mostly to see if something really strange happens (which is fairly common). In this case, the error seems to stabilize after about 4,000 iterations.
After training, the demo code displays the 73 weights and biases values, again mostly as a sanity check. For time-series regression problems, you must typically use a custom accuracy metric. Here, a correct prediction is one where the unnormalized predicted passenger count is plus or minus 30 from the actual count. With that defini- tion, the demo program achieved 91.43 percent accuracy, which is 128 correct and 12 wrong for the 140 predicted passenger counts.
The demo concludes by using the trained neural network to predict the passenger count for January 1961, the first time period past the range of the training data. This is called extrapolation. The prediction is 433 passengers. That value could be used as a predictor variable to forecast February 1961, and so on.
This article assumes you have intermediate or higher program- ming skills and have a basic knowledge of neural networks, but doesn’t assume you know anything about time-series regression. The demo program is coded using C#, but you shouldn’t have too much trouble refactoring the code to another language, such as Java or Python. The demo program is too long to present in its entirety, but the complete source code is available in the file download that accompanies this article.
Time-Series Regression
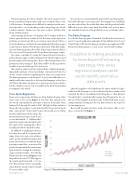
Time-series regression problems are often displayed using a line chart such as the one in Figure 2. The blue line indicates the 144 actual, unnormalized, passenger counts in thousands, from January 1949 through December 1960. The light red line indicates the predicted passenger counts generated by the neural network time-series model. Notice that because the model uses a rolling window with four predictor values, the
You can also use a programmatic approach for spotting anoma- lous data with time-series regression. For example, you could flag any time value where the actual data value and the predicted value differed by more than some fixed threshold, such as four times the standard deviation of the predicted versus actual data values.
The Demo Program
To code the demo program, I launched Visual Studio and created a new C# console application and named it NeuralTimeSeries. I used Visual Studio 2015, but the demo program has no significant .NET Framework dependencies, so any recent version will work fine.
In addition to making predictions for times beyond the training data range, time-series regression analyses can be used to identify anomalous data points.
After the template code loaded into the editor window, I right- clicked on file Program.cs in the Solution Explorer window and renamed the file to NeuralTimeSeriesProgram.cs, then allowed Visual Studio to automatically rename class Program for me. At the top of the template-generated code, I deleted all unnecessary using statements, leaving just the one that references the top-level System namespace.
The overall program structure, with a few minor edits to save space, is presented in Figure 3.
first predicted passenger count doesn’t occur until month = 5. Additionally, I made forecasts for nine months beyond the range of the training data. These are indicated by the dashed red line.
In addition to making predictions for times beyond the training data range, time-series regression analyses can be used to identify anomalous data points. This doesn’t occur with the demo passenger count data—you can see the predicted counts match the actual counts quite closely. For example, the actual pas- senger count for month t = 67 is 302 (the blue dot near the center in Figure 2) and the predicted count is 272. But suppose the actual count for month t = 67 was 400. There’d be an obvious visual indi- cation that the actual count for month 67 was an outlier value. msdnmagazine.com
Figure 2 Time-Series Regression Line Chart
October 2017 65
