
Page 26 - MSDN Magazine, October 2017
P. 26
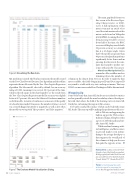
Figure 6 Visualizing the Raw Data
ML models just created. The blue line represents the model created via the Two-Class Boosted Decision Tree algorithm and the red line represents the model created by the Two-Class Logistic Regression algorithm. The blue model, selected by default, has an accuracy rating of 0.806, meaning it was correct 80.6 percent of the time. Click on the red square in the chart legend to see the results from the Two-Class Logistic Regression model. Its accuracy was slightly better at 81.7 percent. Also note, the Matrix of Confusion numbers on both models. A matrix of confusion is a measure of the quality of a classification model. It measures the number of times a record was correctly flagged positively or negatively, as well as how often the model was wrong with “false positives” and “false negatives.”
The main graphical feature on this screen is the Receiver Oper- ating Characteristic, or ROC, curve. A full explanation of this metric warrants an article of its own. More information about this metric can be found on Wikipedia at bit.ly/2fPKJnf. Assuming that ran- dom guessing would be correct about half of the time, the ROC curve would display a model with 50 percent accuracy as a straight line at a 45-degree angle. Given that both models are greater than 80 percent, the algorithm performs significantly better than random guessing. In other words, the com- puter has learned to predict out- comes with a fair bit of accuracy.
More Data Manipulation The remainder of the workflow involves trimming down the number of
columns in the dataset from 31 to six. In order to make the data more readable, the fields OriginAirportID and DestAirportID are joined to a table with city, state, and airport names. That way 12264 becomes more readable as Washington Dulles International.
Wrapping Up
Some of the terms that Azure ML Studio uses are related to statistics and are generally outside the usual vocabulary of most developers. In truth, that’s where the bulk of the learning curve of Azure ML Studio lies, in learning the jargon of data science.
I’ve barely scratched the surface of what can be built with Azure ML Studio. The next step will be making this predictive model acces- sible to Web sites and apps using the built-in support for Web services. In future columns, I’ll explore other aspects of AI both inside and out-
side Azure ML Studio.
While machine learning, artifi-
cial intelligence, and data science in general might seem intimi- dating to the average developer or data engineer, the overall goal of this column is to help you discover that quite the opposite is true. n
Frank La Vigne is a data scientist at Wintel- lect and co-host of the DataDriven podcast. He blogs regularly at FranksWorld.com and you can watch him on his YouTube channel, “Frank’s World TV” (FranksWorld.TV).
Thanks to the following Microsoft technical experts for reviewing this article: Rachel Appel and Andy Leonard
Artificially Intelligent
Figure 7 The Evaluate Model Visualization Dialog 22 msdn magazine
