
Page 30 - Campus Technology, July 2017
P. 30
RESEARCH
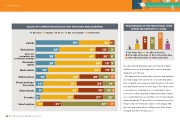
VALUE OF COMPUTING DEVICES FOR TEACHING AND LEARNING
Essential Valuable So-so Not very valuable Detrimental
Laptops
Workstations
All-in-one computers and traditional desktops
Detachable tablets
Media tablets
Mobile phones
Virtual desktops/ thin clients
Chromebooks E-readers Smart watches
2%
54%
40%
4%
30%
46%
15%
9%
25%
48%
20%
6%
25%
56%
16%
3%
16%
62%
19%
3%
13%
43%
25%
12%
7%
10%
41%
34%
14%
9%
44%
33%
37%
12%
3%
39%
20%
9%
21%
61%
9%
PERCENTAGE OF INSTRUCTIONAL TIME WHEN TECHNOLOGY IS USED
0% of the time 1%–25% of the time 26%–50% of the time 51%–75% of the time 76%–99% of the time 100% of the time
30
CAMPUS TECHNOLOGY | July 2017
the same in 2016. And while 9 percent of faculty in 2016 said they never use technology in their courses, that figure dropped to zero this year.
We wanted to know what kinds of devices and hardware are really in play in the classroom, so we asked faculty to dish on what they’re using now, what they’ll use in the next year and what they wish for in the future. The top five most common pieces of hardware in our respondents’ class- rooms are not that surprising: traditional desktop comput- ers or workstations (in use by 84 percent of respondents); traditional laptops (77 percent); non-interactive projectors (72 percent); non-interactive, large-screen displays (63 percent); and mobile phones (58 percent). That list has changed very little from last year.4
0%
10%
24% 23%
11%
32%
