
Page 26 - Campus Technology, July 2017
P. 26
RESEARCH
Who Responded
Our survey polled 232 faculty members across the country about their use of technology in the classroom, their likes and dislikes, their predictions for the future and more. The majority of respondents (68 percent) come from public institutions, with 28 percent from private nonprofits and 4 percent working at for-profit schools. Seventy-two percent work at four-year colleges or universities; 26 percent are at community colleges (the remaining 2 percent designat- ed their institutional level as “other”).
Respondents represent institutions of a range of sizes, with about one-third (32 percent) working in colleges or
universities with 2,500 to 9,999 students. Just under half (45 percent) of respondents are from institutions with 10,000 students or more.
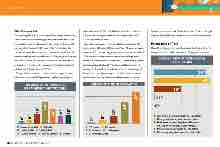
Our respondents are veterans of higher education: The largest group (47 percent) has more than 20 years of expe- rience, with 81 percent logging at least 11 years in the field.
The top three most common school and college types among our respondents are education (22 percent), business/ business administration (17 percent) and liberal arts (12 percent). But overall, respondents work in a wide range of disciplines, from engineering and medicine to humanities and fine arts. The top 10 states with the most survey re-
spondents are New York, Texas, California, Florida, Georgia, Virginia, Illinois, Missouri, Pennsylvania and Massachusetts.
Perspective on Tech
Overall, faculty in our survey hold an upbeat view of tech- nology’s value in higher education: Eighty percent think
OVERALL VIEW OF TECHNOLOGY IN EDUCATION
38%
42%
19%
<1% 0%
Extremely positive impact on education Mostly positive impact on education Both positive and negative effects on education in roughly equal measure Mostly negative impact on education Extremely negative impact on education
LENGTH OF TIME IN EDUCATION
0-2 years 3-5 years 5-10 years 11-20 years 21 or more years
NUMBER OF STUDENTS IN RESPONDENT INSTITUTIONS
Fewer than 500 1,000-2,499 10,000-19,999
500-999 2,500-9,999
20,000-29,999 30,000+
26
CAMPUS TECHNOLOGY | July 2017
4% 5%
2% 5%
15%
32% 22%
11% 12%
12%
34%
47%
