
Page 19 - College Planning & Management, February 2018
P. 19
2018 FACILITIES & CONSTRUCTION BRIEF
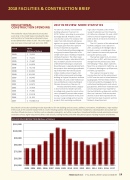
EDUCATIONAL CONSTRUCTION SPENDING
The total dollar value of educational construction work done in the United States (including 50 states and the District of Columbia) is estimated to have exceed $99.6 billion dollars in 2017. This is the largest year-over-year increase we have seen since 2008.
YEAR
TOTAL
(Millions of Dollars)
2003
$ 74,315
2004
$ 74,251
2005
$ 79,687
2006
$ 84,929
2007
$ 96,758
2008
$ 104,891
2009
$ 103,203
2010
$ 88,405
2011
$ 84,986
2012
$ 84,673
2013
$ 79,059
2014
$ 79,681
2015
$ 83,518
2016
$ 91,953
2017
$ 99,580 (est)
Educational construction spending includes expenditures for new buildings and structures, additions, renovations, rehabilitations, major replace- ments (such as the complete replacement of a roof or heating system); mechanical and electrical installations; site preparation and outside con- struction of fixed structures or facilities such as sidewalks, parking lots, and utility connections. Educational facilities include preschools, primary/
secondary schools, higher education
EDUCATIONAL CONSTRUCTION
fac
iliti
rad
es, t
train
and
red
ls
es including museums and libraries.
es
ch
oo
2017 IN REVIEW: MORE STATISTICS
For 2017 as a whole, nonresidential building advanced 7 percent to
$270.7 billion, according to an analysis by Dodge Data & Analytics (www. construction.com). The analysis indi- cates that institutional building cat- egories as a group climbed 14 percent, a stronger gain than the 9 percent increase reported during 2016.
The institutional building categories as a group increased 9 percent in De- cember 2017 alone. Healthcare facilities climbed 29 percent. The other major institutional category, educational facili- ties, receded 7 percent in the month
of December following its 13 percent November gain. Large educational facili- ties projects that reached groundbreak- ing in December were led by a $135 million middle school in Sparks, NV;
a $90 million science and technology building at Virginia Polytechnic Institute in Roanoke, VA; and an $87 million busi- ness and behavior science building at Clemson University in Clemson, SC.
The educational facilities category in 2017 overall increased 6 percent,
as college and university construction starts jumped 20 percent after experi- encing a 3 percent decline in the previ- ous year. Large college and university projects that reached groundbreak-
ing in 2017 included a $421 million research laboratory at the University of California in Merced, CA, and a $327 million school of engineering and ap- plied sciences at Harvard University in Allston, MA.
The K–12 portion of the educational facilities category rose 5 percent in 2017, according to the Dodge Data & Analytics report; a smaller gain than the 14 percent increase they reported during the previous year.
The top five states for K–12 school construction in 2017, with their percent change from the previous year, were the following—Texas, down 4 percent; New York, up 24 percent; California, up 13 percent; Washington, up 43 percent; and Ohio, up 9 percent.
The 3 percent increase for total construction starts at the national level in 2017 was the result of mixed behavior by geography. The Northeast climbed
17 percent, aided by strong gains for its institutional building sector and natural gas pipelines, while more moderate total construction growth was reported for the South Atlantic, up 6 percent; and the West, up 3 percent. Total construction declines in 2017 were reported for the South Central, down 3 percent; and the Midwest, down 8 percent.
ls,
ing
fac
iliti
es,
ot
he
tio
uca
pac
na
EDUCATION CONSTRUCTION (Millions of D[oMllarisl)lions of Dollars]
$110,000 $100,000 $90,000 $80,000 $70,000 $60,000 $50,000
2003 2004 2005 2006 2007 2008 2009 2010 2011 2012 2013 2014 2015 2016 2017
FEBRUARY 2018 / COLLEGE PLANNING & MANAGEMENT 19
