
Page 10 - THE Journal, May/June 2018
P. 10
FEATURE | Teaching with Tech
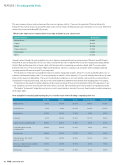
The most common devices used in classrooms this year were laptops, cited by 37 percent of respondents. That was followed by Chromebooks at about 14 percent and mobile phones also at about 14 percent. Paper/pencil came in fourth at 12.5 percent, followed by tablets (10 percent) and desktop PCs (9 percent).
What is the single most common device used by students in your classroom?
Among teachers, though, the most popular devices were laptops running traditional operating systems (Windows, macOS, Linux), with about 91 percent saying those devices are either essential (46 percent) or valuable (44 percent) for teaching and learning. Media tablets (iPads and Amazon devices) barely edged out Chromebooks for a surprising second place finish, with 77 percent positive. Chromebooks were at 76 percent positive. High-end workstations, all-in-one computers and detachable tablets running traditional operating systems all came in around 72 percent positive.
For the first year of this survey, smartphones had more positive ratings than negative. About 6.5 percent said mobile phones are es- sential to teaching and learning, with 35 percent saying they’re valuable. A bare majority (52.5 percent) said they allow the use of smart- phones in the classroom. Meanwhile, 16 percent of respondents said phones are not very valuable, and nearly 14 percent said they’re detrimental to teaching and learning, and 20 percent reported that their institutions ban students from bringing phones on campus.
Confiscation is the penalty for using cell phones in the classroom among 60 percent of respondents, followed by suspension (5 per- cent), expulsion (1 percent) and referral to law enforcement (1 percent). The remainder reported no penalty or no significant penalty.
The highest “detrimental” rating this year, however, went to smart watches, at nearly 16 percent. Smart watches’ positive ratings were in the single digits.
How valuable for teaching and learning do you consider each of the following computing devices?
Answer Choices
Responses
Mobile phone
13.66%
Laptop
36.63%
Tablet
10.17%
Paper and pencil
12.50%
Smart watch
0.00%
Other
27.03%
Essential
Valuable
So-So
Not Very Valuable
Detrimental
Mobile phones
6.41%
35.28%
28.57%
16.03%
13.70%
Smart watches
1.47%
6.18%
24.41%
52.35%
15.59%
Media tablets
20.76%
56.14%
17.84%
5.26%
0.00%
E-readers
4.72%
36.28%
38.94%
19.17%
0.88%
Laptops running a traditional OS
46.06%
44.61%
8.16%
0.87%
0.29%
Detachable tablets running a traditional OS
20.06%
52.51%
21.83%
5.01%
0.59%
Chromebooks
36.84%
39.47%
15.79%
7.31%
0.58%
Virtual desktops, thin clients and zero clients
7.48%
36.76%
38.63%
14.33%
2.80%
All-in-one computers (such as iMac) and traditional desktops
27.35%
45.29%
19.71%
6.47%
1.18%
Workstations
31.56%
41.59%
21.83%
4.13%
0.88%
10 | MAY/JUNE 2018
