
Page 9 - THE Journal, January/February 2018
P. 9
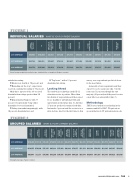
FIGURE 1
INDIVIDUAL SALARIES WHAT IS YOUR CURRENT SALARY?
2018 AVERAGE
$66,640
$100,000
$82,843
$87,000
$75,778
$68,652
$78,800
$61,553
$75,192
$57,036
2017 AVERAGE
$65,742
$99,583
$78,997
$76,333
$85,667
$71,208
$50,000
$51,556
$63,000
$61,039
2016 AVERAGE
$63,776
$105,469
$76,052
$76,436
$75,029
$62,752
$60,035
$58,735
$58,000
$56,905
Overall average weighted by institution type; individual titles not weighted. All figures rounded.
satisfaction rating;
Hours were fourth at 70 percent; and Rounding out the top 5, supervisors
received a satisfaction rating of 68 percent. Only three aspects of the job received
dissatisfaction ratings greater than 20 percent:
Departmental budgets, with 37 percent of respondents being either dissatisfied or very dissatisfied;
Salary (somewhat surprisingly), with 30 percent dissatisfaction; and
FIGURE 2
“Top brass,” with a 23 percent dissatisfaction rating.
Looking Ahead
The outlook in technology in the K–12 education sector is positive. More than two-thirds of respondents said they expect to see healthy or unbridled growth and opportunity in the future (fig. 8). Another 27 percent predicted continued stability. Just under 6 percent said the sector is in a slow decline. And, for the first time in this
survey, zero respondents predicted doom in the near future.
A majority of our respondents said they expect to receive a pay raise (fig. 5) in the next year (51 percent), though the vast majority (91 percent) said they won’t receive a new title to go along with it (fig. 6).
Methodology
THE Journal polled its readership in the summer and fall of 2017. We put out an open invitation to IT professionals in edu-
GROUPED SALARIES WHAT IS YOUR CURRENT SALARY?
2018 AVERAGE
$100,400
$78,140
$70,636
$79,650
$91,333
$68,810
$66,774
$68,810
$77,667
$74,664
$65,576
$40,410
$57,305
2017 AVERAGE
$102,075
$76,806
$75,167
$65,333
$75,449
$66,383
$70,157
$51,154
$61,193
$56,000
$61,195
$45,107
$59,034
2016 AVERAGE
$99,045
$72,994
$74,940
$57,256
$76,436
$61,048
$64,329
$60,774
$58,633
$41,938
$55,185
$41,425
$57,049
Unweighted averages. Figures rounded.
JANUARY/FEBRUARY 20187 | 9
shutterstock.com
C-LEVEL (CIO/ CTO/CSO/CDO)
OVERALL (EXCLUDING TEACHERS)
OTHER IT MANAGEMENT
PROJECT MANAGEMENT
DEVELOPMENT/ APPLICATIONS STAFF
INFORMATION TECHNOLOGY/IT DIRECTOR
DATABASE/ BUSINESS INTELLIGENCE STAFF
DATABASE ADMINISTRATOR
NETWORK/ DATA CENTER MANAGEMENT
PROJECT MANAGER
INSTRUCTION DESIGN/ TECHNOLOGY
NETWORK/ DATA CENTER/ SECURITY STAFF
WEB/DIGITAL MEDIA STAFF
SYSTEMS ADMINISTRATOR
SYSTEMS ANALYSIS
NETWORK ADMINISTRATOR
TRAINER
HELP DESK/ COMPUTER SUPPORT
LIBRARIAN/ LIBRARY MEDIA SPECIALIST/ MEDIA SPECIALIST
TECHNOLOGY TEACHER
CIO
DIRECTOR OF
IT MANAGER
WEB DEVELOPER
