
Page 12 - THE Journal, January/February 2018
P. 12
FEATURE | TECH TRENDS
somewhat closely with ED’s regional data for K-12 institutions (using census regions), with the East South Central region the only significantly overrepresented area. New England: 6.8 percent; Mid Atlantic: 11.8 percent; East North Central: 14.2 percent; West North Central: 6.8 percent; South Atlantic: 30.2 percent; East South Central: 8 percent; West South Central: 8.8 percent;
FIGURE 8
Mountain: 5.9 percent; and Pacific: 7.4 percent.
The breakdown in student body size among vetted respondents was: 0-499: 19.8 percent; 500-999: 26.7 percent; 1,000-1,499: 15.4 percent; 1,500-1,999: 5.3 percent; 2,000-2,999: 7.4 percent; and 3,000 or more: 25.4 percent.
The survey consisted of 14 questions,
13 of which were mandatory. A final open-ended question asking for additional comments was optional.
David Nagel is editor-in-chief of THE Journal and editorial director for 1105 Media’s education publications.
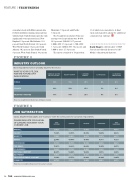
INDUSTRY OUTLOOK
Most respondents foresee a healthy future for the sector.
WHAT IS YOUR OUTLOOK FOR THE FUTURE OF IT IN EDUCATION?
Responses weighted by institution type. All figures rounded.
UNBRIDLED GROWTH AND OPPORTUNITY
HEALTHY GROWTH
CONTINUED STABILITY
SLOW DECLINE
DOOM IN THE NEAR FUTURE
PUBLIC
14%
53%
27%
6%
0%
PRIVATE
10%
58%
27%
5%
0%
WEIGHTED AVERAGE
13%
54%
27%
6%
0%
FIGURE 9
JOB SATISFACTION
Salary, departmental budgets and “top brass” were the sorest points for our survey respondents.
PLEASE INDICATE YOUR LEVEL OF SATISFACTION WITH YOUR CURRENT JOB.
VERY SATISFIED
SATISFIED
NEUTRAL
UNSATISFIED
VERY UNSATISFIED
OVERALL
23.92%
52.82%
13.95%
4.65%
4.65%
SALARY
SUPERVISOR
PHYSICAL COMFORT
Responses not weighted. Responses from teachers excluded.
11.30%
33.55%
25.58%
14.62%
19.93%
8.94%
9.63%
BENEFITS
17.00%
48.00%
19.67%
10.67%
4.67%
HOURS
22.59%
47.84%
15.95%
8.31%
5.32%
31.13%
36.75%
16.56%
6.62%
TOP BRASS
15.61%
32.23%
29.24%
13.95%
8.97%
CO-WORKERS
33.22%
47.18%
12.96%
3.32%
3.32%
26.25%
52.49%
3.65%
2.99%
EQUIPMENT
19.93%
42.52%
19.27%
14.29%
3.99%
YOUR DEPARTMENT’S BUDGET
11.30%
27.57%
23.92%
23.26%
13.95%
COMMUTE
42.72%
27.81%
14.90%
9.60%
4.97%
12 | JANUARY/FEBRUARY 2001178
