
Page 11 - School Planning & Management, February 2018
P. 11
2018 FACILITIES & CONSTRUCTION BRIEF
EDUCATIONAL CONSTRUCTION SPENDING
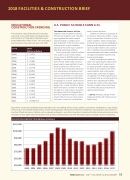
The total dollar value of educational construction work done in the United States (including 50 states and the District of Columbia) is estimated to have exceed $99.6 billion dollars in 2017. This is the largest year-over-year increase we have seen since 2008.
U.S. PUBLIC SCHOOLS EARN A D+
The American Society of Civil
Engineers (ASCE) publish an annual Infrastructure Report Card. The 2017 report graded the nation’s public school buildings’ condition as D+, with 24 percent of the structure rated as being in fair to poor condition. Excerpts of from the report state the following interesting statistics.
Every school day, nearly 50 million K-12 students and 6 million adults occupy close to 100,000 public school buildings on an estimated two million acres of land. While state and local governments make significant invest- ment in public K-12 schools infra- structure and schools play important civic, educational, and public safety roles in communities, the nation con- tinues to underinvest in school facili- ties, leaving an estimated $38 billion annual gap. As a result, 24 percent of public school buildings were rated as being in fair or poor condition. While there have been a number of insight- ful reports in recent years, state and local governments are plagued by a lack of comprehensive data on public school infrastructure as they seek to fund, plan, construct, and maintain
quality school facilities.
Student enrollment is projected to
increase by 3 percent by 2025—rising from just more than 50 million to 51.4 million students. State and local gov- ernments face a constant challenge to keep up with operations and mainte- nance and the need for new construc- tion, in addition to accommodating improved health and safety standards, stronger accessibility requirements, and new technology.
School funding varies widely by state. Five states pay for nearly all of their school districts’ capital costs,
12 states provide no direct support for districts for capital construction responsibilities, and in the remain- ing 33 states, the levels of support vary greatly. The federal government contributes little to no funding for the nation’s K-12 educational facilities.
To read the section of the report that focuses on public school structures, visit www.infrastructurereportcard. org/cat-item/schools/.
— Source: American Society of Civil Engineers (ASCE), 2017 Infrastructure Report Card
YEAR
TOTAL
(Millions of Dollars)
2003
$ 74,315
2004
$ 74,251
2005
$ 79,687
2006
$ 84,929
2007
$ 96,758
2008
$ 104,891
2009
$ 103,203
2010
$ 88,405
2011
$ 84,986
2012
$ 84,673
2013
$ 79,059
2014
$ 79,681
2015
$ 83,518
2016
$ 91,953
2017
$ 99,580 (est)
Educational construction spending includes expenditures for new buildings and structures, additions, renovations, rehabilitations, major replace- ments (such as the complete replacement of a roof or heating system); mechanical and electrical installations; site preparation and outside con- struction of fixed structures or facilities such as sidewalks, parking lots, and utility connections. Educational facilities include preschools, primary/
EDUCATIONAL CONSTRUCTION
secondary schools, higher education
EDUCATION CONSTRUCTION (Millions of D[oMllarisl)lions of Dollars] $110,000
$100,000 $90,000 $80,000 $70,000 $60,000 $50,000
fac
iliti
rad
es
ch
oo
ls,
ing
fac
iliti
es,
ot
na
2003 2004 2005 2006 2007 2008 2009 2010 2011 2012 2013 2014 2015 2016 2017
es, t
train
and
red
ls
es including museums and libraries.
he
tio
uca
pac
Source: U.S. Census Bureau
FEBRUARY 2018 / SCHOOL PLANNING & MANAGEMENT 11
