
Page 10 - spaces4learning, Fall 2024
P. 10
2024 FACILITIES & CONSTRUCTION BRIEF
s p a c e s 4 l e a rn i n g
programs/digest/d23/tables/dt23_203.10.asp.)
NCES projections on private PreK–12 school enrollment have
recently been updated to reflect the expected impacts of the
coronavirus pandemic. While NCES projected small boosts in
enrollment for private schools during the pandemic, long-term
projections now mirror the declines expected on the public side.
Overall, projections for enrollments in PreK–12 education
have been revised downward—where revisions have been made
to previous data—through 2031.
DEGREE-GRANTING POST-SECONDARY
In higher education, 18.94 million students were projected to
attend colleges and universities in 2023. Of those:
• 11.51 million were full-time.
• 7.43 million were part-time.
• 13.86 million were enrolled in public institutions.
• 5.08 million were enrolled in private institutions.
Overall, projections for enrollments in higher education have
been revised downward through 2031.
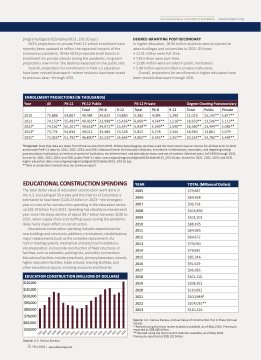
ENROLLMENT PROJECTIONS (IN THOUSANDS)
Year All PK-12 PK-12 Public PK-12 Private egreeGranting ostsecondary
Total PK-8 9-12 Total PK-8 9-12 Total Public Private
2 0 1 0 7 5 , 8 8 6 5 4 , 8 6 7 4 9 , 4 8 4 3 4 , 6 2 5 1 4 , 8 6 0 5 , 3 8 2 4 , 0 8 4 1 , 2 9 9 2 1 , 0 1 9 1 5 , 1 4 2 * * 5 , 8 7 7 * *
2 0 2 1 7 4 , 1 5 3 * * 5 5 , 4 9 3 * * 4 9 , 4 3 3 * * 3 3 , 9 9 8 * * 1 5 , 4 3 6 * * 6 , 0 6 0 * * 4 , 5 4 4 * * 1 , 5 1 6 * * 1 8 , 6 5 9 * * 1 3 , 5 4 6 * * 5 , 1 1 3 * *
2 0 2 2 * 7 4 , 1 6 2 * * 5 5 , 2 0 1 * * 4 9 , 6 1 8 * * 3 4 , 0 7 1 * * 1 5 , 5 4 7 * * 5 , 9 3 9 * * 4 , 3 9 9 * * 1 , 5 4 0 * * 1 8 , 5 8 0 * * 1 3 , 4 9 4 * * 5 , 0 8 6 * *
2 0 2 3 * 7 3 , 7 7 4 5 4 , 8 3 4 4 9 , 0 1 2 3 3 , 4 8 4 1 5 , 5 2 8 5 , 8 2 2 4 , 2 7 8 1 , 5 4 4 1 8 , 9 4 0 1 3 , 8 6 1 5 , 0 7 9
2 0 3 1 * 7 2 , 0 2 6 * * 5 1 , 7 9 2 * * 4 6 , 8 9 0 * * 3 2 , 2 2 5 * * 1 4 , 6 6 4 * * 4 , 9 0 2 * * 3 , 5 4 5 * * 1 , 3 5 7 * * 2 0 , 2 3 4 * * 1 4 , 7 8 5 * * 5 , 4 4 9 * *
rojected. N o t e t h a t d a t a a r e t a k e n f r o m t h r e e s o u r c e s f r o m N C E S . W h e r e d a t a d i s a g r e e , w e h a v e u s e d t h e m o s t r e c e n t s o u r c e . S o u r c e f o r a l l d a t a p r i o r t o 2 0 2 2
and private PreK–12 data for 2021, 2022, 2023, and 2031: National Center for Education Statistics, Enrollment in elementary, secondary, and degree-granting
postsecondary institutions, by level and control of institution, enrollment level, and attendance status and sex of student: Selected years, fall 1990 through 2031.
Source for 2021, 2022, 2023, and 2031 public PreK–12 data: nces.ed.gov/programs/digest/d23/tables/dt23_203.10.asp. Source for 2021, 2022, 2023, and 2031
higher education data: nces.ed.gov/programs/digest/d23/tables/dt23_303.10.asp.
**Data or projections revised since our previous report.
2005 2006 2007 2008 2009 2010 EDUCATIONAL CONSTRUCTION SPENDING YEAR The total dollar value of education construction work done in
the U.S. (including all 50 states and the District of Columbia) is
estimated to have been $120.23 billion in 2023—the strongest
year on record for construction spending in the education sector,
up $16.19 billion from 2022. Spending has steadily increased each
year since the steep decline of about $9.7 billion between 2020 to
2021, when supply chain and staffing issues during the pandemic
likely had a major effect on construction.
Educational construction spending includes expenditures for
new buildings and structures; additions; renovations; rehabilitations;
m a j o r r e p l a c e m e n t s ( s u c h a s t h e c o m p l e t e r e p l a c e m e n t o f a
roof or heating system); mechanical and electrical installations;
site preparation; and outside construction of fixed structures or
facilities, such as sidewalks, parking lots, and utility connections.
Educational facilities include preschools, primary/secondary schools,
higher education facilities, trade schools, training facilities, and
other educational spaces, including museums and libraries.
TOTAL (Millions of Dollars)
$79,687
$84,928
$96,758
$104,890
$103,202
$88,405
2011 $84,985
2012 $84,672
2013 $79,060
2014 $79,681
2015 $85,346
2016 $91,629
2017 $96,685
EDUCATION CONSTRUCTION (MILLIONS OF DOLLARS)
2018 $101,210
$120,000
$110,000
$100,000
$90,000
$80,000
$70,000
$60,000
$50,000
2019 $108,952
2020 $110,692
2021 $100,988*
2022 $104,035**
2023 $120,226
2005
2006
2007
2008
2009
2010
2011
2012
2013
2014
2015
2016
2017
2018
2019
2020
2021
2022
2023
ource U.S. Census Bureau, Annual Value of Construction Put in Place (Annual
Totals).
* Revised using the most recent statistics available, as of May 2024. Previously
reported at $98,426 billion.
** Revised using the most recent statistics available, as of May 2024.
Previously reported at $99,191 billion.
ource U . S . C e n s u s B u r e a u
10 FALL 2024 | spaces4learning.com