
Page 30 - spaces4learning, Spring 2021
P. 30
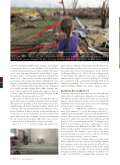
JOPLIN, MO - MAY 22, 2011: The killer EF-5 tornado which caused extensive damage and 160 deaths forever changed the lives of young and old alike who experienced the devastation.
intensity—until two incredibly violent tornadoes caused experts to reconsider the F Scale’s accuracy. On May 27, 1997, Jarrell, Tex- as suffered devastating destruction when a tornado three-quar- ters of a mile long ripped through the town, killing 27 people. Its slow movement on the ground coupled with estimated wind speeds over 200 mph caused the tornado to spin almost in place in certain areas for as long as three minutes, ripping apart every- thing it touched and leaving only small remnants behind. Then, on May 3, 1999, deadly storms yielded what was later determined to be an EF5, this time striking Moore, Okla. Carving a path some 37 miles long and with wind speeds estimated to have ex- ceeded 300 mph, the storm killed 36 people and injured another 583, making it the deadliest strike since 1979.
The amount of damage and destruction from these two tor- nadoes made engineers, emergency managers and meteorologists alike question if the Fujita scale of measurement was an over- simplified approach toward classifying tornadoes. Mostly, the F scale was a subjective assessment based on the damage to a select group of buildings. It did not take into account multiple types of construction or construction materials, nor did it correlate wind speeds with certain types of damage. Accuracy in determining the scale of each tornado was almost impossible, as was consisten- cy, and it was thus determined that a change was needed.
From 2001 to 2004, a panel of engineering and meteoro-
PHOTO CREDIT DUSTIE
logical experts conducted an investigation into the Fujita scale. Their knowledge and efforts led to the creation of a more ro- bust and accurate method of determining a tornado’s intensity: the Enhanced Fujita Scale. Still based upon a damage analy- sis methodology, this enhanced version used a combination of damage indicators (types of structures) and degrees of damage for each indicator. It also correlated the wind speed with the vi- sually-observed damage. In 2007, the National Weather Service adopted the Enhanced Fujita scale, and it is still in use today.
Building Storm Shelters
The Enhanced Fujita Scale allowed for more accurate and quan- tifiable data to be gathered, providing greater knowledge as to how different materials and structures behave in a tornado. Ul- timately, this information led to the creation of a standard that would drive better design and construction for safer buildings, stronger products, testing and verification.
Using the 2000 FEMA P-361 guideline as a legacy docu- ment, in the summer of 2008, the first version of the ICC 500 Standard for the Design and Construction of Storm Shelters was released. This consensus standard codified the design and con- struction of commercial storm shelters for both hurricanes and tornadoes. It also set a minimum standard of building for these facilities for governments and various organizations to adopt. Under the International Building Code (IBC), ICC 500 storm shelters became required components of certain types of facil- ities being built: fire, ambulance, police and 911 call centers, as well as emergency operations centers—and, most relevantly, K-12 school facilities with 50 or more occupants.
As knowledge around building safer and stronger storm shelters expanded, it became apparent that building materials and components such as doors and windows would need to en- dure specific tests to ensure their ability to withstand the winds, pressures and debris of a tornado. It was also deemed unlikely that many standard components could pass the difficult tests needed to become ICC 500-compliant. One of the most chal-
Blast Testing
30 SPRING 2021 | spaces4learning.com
