
Page 43 - OHS, September 2021
P. 43
Make sure your voice is being heard, and you’re being recognized for the significant contributions to overall business goals.
t t
Visually Demonstrate Risk
■ What’s the job/activity in red?
■ Do we have data confirming the risk levels?
■ How are we protecting these workers today?
■ How do we move the risk from a red to a yellow, or even
green?
By presenting IH data using a familiar risk matrix, we now
have an engaged audience that wants to have a dialogue and work with you to address those risks. It can also help grab the attention of management and secure approval for investment in workplace exposure controls.
A cloud EHS software solution with robust IH capabilities that simplify the coordination and control of your IH program will also help you communicate the value of IH across your organization. The best systems enhance the visibility of workplace risks and allow you to quickly generate detailed risk matrices that visually communicate risks to management. These systems also help you better visualize key data and reports in real-time to help you make faster, more confident IH management decisions.
Communicate Control Measures
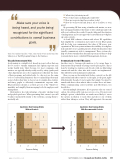
Another way to leverage risk matrices is by using them to demonstrate the potential of having controls put in place. This is done by creating two matrices side by side, with one illustrating current risk and the other after risk controls are implemented. This will tell you the initial and residual risk.
Here, we can see the initial risk (before controls) on the left and residual risk (after controls) on the right. Looks great, right? Unfortunately, though, it’s never quite that simple. You must be armed with data to show what it takes to reduce those red items. When communicating control activities and effectiveness, you should also:
Present multiple alternatives. If you present only one control option, the only possible responses are yes or no. If you present multiple options, stakeholders are much more likely to assess the options in relation to each other and choose one of them rather than taking no action. They will appreciate the amount
h
d
e
y y
t t
t t
y y
t t
h
o
n
’
t
u
n
d
e
r
s
t
a
n
d
h
e
“
e
value you or the IH program brings to the business.
d
e
h
d
o
n
’
t
u
n
d
e
r
s
t
a
n
d
h
e
“
w
h
w
h
y
y
”
”
,
h
,
h
e
s
e
s
u
u
r
r
e
e
l
l
y
w
y
w
o
o
n
n
’
’
t
u
t
u
n
n
d
d
e
e
r
r
s
s
t
a
t
a
n
n
d
h
e
A risk matrix is a valuable tool already in your toolbox that can also be used to visually summarize and explain exposure and worker health risks. That’s because, for most companies, risk matrices are typically already widely used by safety, quality and other departments across the organization to illustrate the status of their programs and related risks. So, why not use the same tools to convey IH information? Far too many IH professionals seem to believe they have to show a ton of complex data, statistics and fancy graphs to effectively communicate exposure risks. IH practitioners should, as a whole, get out of the “black box” mentality and simplify their messaging for both employees and management.
Risk matrices also take advantage of peoples’ existing visual and psychological cues. When presenting data, viewers’ eyes will be almost instinctively drawn to the red items, causing them to inevitably ask:
Qualitative Risk Ranking Matrix Without Controls
4 3 2 1
2
6
8
4
2
3
3
1
8
2
10
8
18
3
7
2
1234 Exposure Rating
Qualitative Risk Ranking Matrix With Recommended Controls
4 3 2 1
2
18
0
0
2
6
1
0
8
8
10
2
18
3
7
2
1234 Exposure Rating
www.ohsonline.com
SEPTEMBER 2021 | Occupational Health & Safety 39
Health Effect Rating
Health Effect Rating
