
Page 94 - Occupational Health & Safety, October 2018
P. 94
RISK MANAGEMENT
tive relationships between safety and productivity are backed up by organizations that gather global statistics on accidents and in- cidents. Using this information to justify investments in safety re- quires a more sophisticated financial analysis and data. The simple formula for return on investment (dividing savings by cost) does not capture the potential savings from safety investments.
Martin Engineering’s recently published book “FOUNDA- TIONS TM for Conveyor Safety” provides a road map for justifying investments in safety. When specific data isn’t available, the book provides numerous references and global averages for conveyor safety that can be used to reasonably estimate the benefits of invest- ments in safety. The financial analysis approach depends upon the potential benefit being sought.
Many companies don’t want safety information publicized, and the costs are spread out in accounts such as employee ben- efits, insurance, or reserves accounts, making objective analysis difficult. However, this topic has been widely studied by academia, and while opinions vary, there are enough valid studies that the results can be averaged. For example, several organizations provide detailed and regional statistics on the cost of accidents. \[Figure 2\]
By spending $750,000 more to exceed the minimum safety and design requirements and reduce the accident rates by 50 percent, the annual projected cost of accidents drops from $140,813 to $70,407.
varying costs and savings (cash flows) over time by discounting them by the company’s cost of money. Another way of thinking about this is that the discount rate adjusts for the cost of money over time, so different alternatives in today’s money can be com- pared objectively.
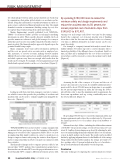
For example, a company’s internal risk analysis reveals that a facility will have 30 workers exposed to conveyor hazards. The es- timated probability of the different classes of accidents (fatal, lost time, and first aid) is multiplied by the cost of these accidents to reveal what could be invested to reduce the incident rate by half. \[Figure 4\]
Assuming the life of the conveyor is 20 years and the cost of money (discount rate) is 5 percent, the available additional invest- ment would be about $750,000 more in design time to accomplish the 50 percent improvement in safety. By choosing the lowest- priced bid in order to meet the minimum safety requirements, the short-term expenditure ends up costing considerably more over the 20-year lifecycle. \[Figure 5\]
By spending $750,000 more to exceed the minimum safety and design requirements and reduce the accident rates by 50 percent, the annual projected cost of accidents drops from $140,813 to $70,407.
Measured in today’s dollars—including the additional investment of $750,000—the projected savings over the 20-year term at 5% are about $1.2 million by investing more up front. By adjusting for indi- rect costs and including them in the estimated direct cost of accidents, a more in-depth analysis can be made. The results can be modified further by applying judgment factors for the likelihood of the savings being realized. If, after further analysis, the savings are found to be less—perhaps only a 25 percent reduction in the cost of accidents— the up-front investment is still justified over the long term.
Conclusion
The same technique of comparing the current situation to future
Lacking specific historical data, managers can turn to numer- ous reliable sources that provide the probability of accidents and incidents that can be used to estimate tangible and intangible fu- ture costs. \[Figure 3\]
“FOUNDATIONS for Conveyor Safety” contains examples that can answer the two questions posed at the beginning of this article. Managers at every level of the organization will be able to see how an engineering firm might convince an owner to spend more on design to improve future safety using the statistics from Figures 1 and 2 or using actual data (in whole or in part) in conjunction with these statistics.
The financial technique used to compare options is called a “net present value” (NPV) analysis. Most spreadsheet programs have a function that can calculate NPV once the proper information is en- tered. Basically, NPV compares different investment options with
90 Occupational Health & Safety | OCTOBER 2018
www.ohsonline.com
