
Page 30 - MSDN Magazine, July 2018
P. 30
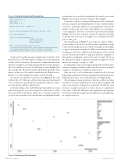
Figure 2 Code for Scattertext Visualization
visualization. In a crowded visualization, this can be very useful. Figure 3 shows the Scattertext output for this example.
Scattertext works by counting word frequencies for each intent’s utterance examples and displaying the words in a way that makes it easier to determine differences and similarities between the intents. At this point, the counts only include one-word expres- sions (unigrams). However, if you have expressions that include multiple words, such as “auto pay,” you can do some pre-processing to specify what you want. For example, you could represent “auto pay” as “auto_pay.”
The visualization in Figure 3 shows the two intents—Other- ServicesIntent on the X axis and PersonalAccountsIntent on the Y axis. Words that appear closer to the bottom right are more likely to appear in utterance examples for OtherServicesIntent, such as “mortgages” and “rates,” while words that appear on the top left are those that are more likely to appear in utterance examples for PersonalAccountsIntent, such as “my” and “account.” Words on the diagonal are likely to appear in utterance examples for both intents, for example, “savings” or “what.”
Learning that certain words appear frequently in both intents’ utterance examples can help you fine-tune the utterance examples to improve classification confidence and accuracy.
One way to do so is by adding more distinct words or by even rephrasing each intent’s utterance examples that include the words frequently in both so as to render them more distinguishable.
The advantage of using Scattertext is that it’s possible to get value from the tool even for small data sets, such as my toy example with only seven utterance examples for each intent. Clearly, the more utterance examples per intent you have, the more complicated it becomes to find the differences and similarities among them. Scattertext can help you appreciate the differences and similarities in a rapid visual way.
import scattertext as st import space
import pandas as pd
examples_data_location = 'example.csv'
two_df = pd.read_csv(examples_data_location, encoding = 'utf8') nlp = spacy.en.English()
corpus = st.CorpusFromPandas(two_df,
category_col='intent', text_col='utterance', nlp=nlp).build()
html = st.produce_scattertext_explorer(corpus, category='PersonalAccountsIntent',category_name='PersonalAccountsIntent', not_category_name='OtherServicesIntent', width_in_pixels=1000)
open("MSDN-Visualization.html", 'wb').write(html.encode('utf-8'))
Now I need to feed the utterance examples into Scattertext. To do that, I’ll create a CSV table with two columns, one for the utterances and the other for the intents. The utterance column will include the utterance examples as one string, separated by the new-line character. (If you’re using Excel, you can use Alt+Enter to enter multiple lines into a single cell.) The intent column will include the labels of the intents, in this case, PersonalAccountsIntent and OtherServices- Intent. So, for this example the result is a 2x2 CSV table.
You can now use Python to run the code in Figure 2. The code will load the CSV table into a Panda data frame and then hand it over to Scattertext, specifying a few parameters related to catego- ries (the intents) and the output format.
Scattertext will produce an HTML page that includes a visual- ization showing the top words unique for each intent, as well as those shared by both intents. There’s also a search box that lets you look for particular words, that if found, are highlighted in the
Figure 3 Scattertext Visualization 24 msdn magazine
Cognitive Services
