
Page 54 - MSDN Magazine, June 2018
P. 54
TesT Run JAMES MCCAFFREY Neural Regression Using CNTK
The goal of a regression problem is to make a prediction where the value to predict is a single numeric value. For example, you might want to predict the height of a person based on their weight, age and sex. There are many techniques that can be used to tackle a regression problem. In this article I’ll explain how to use the CNTK library to create a neural network regression model.
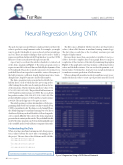
A good way to see where this article is headed is to take a look at the demo program in Figure 1. The demo program creates a regression model for the well-known Yacht Hydrodynamics Data Set benchmark. The goal is to predict a measure of resistance for a yacht hull, based on six predictor variables: center of buoyancy of the hull, prismatic coefficient, length-displacement ratio, beam- draught ratio, length-beam ratio and Froude number.
The demo program creates a neural network with two hidden layers, each of which has five processing nodes. After training, the model is used to make predictions for two of the data items. The first item has predictor values (0.52, 0.79, 0.55, 0.41, 0.65, 0.00). The predicted hull resistance is 0.0078 and the actual resistance is 0.0030. The second item has predictor values (1.00, 1.00, 0.55, 0.56, 0.46, 1.00). The predicted hull resistance is 0.8125 and the actual resistance is 0.8250. The model appears to be quite accurate.
This article assumes you have intermediate or better pro- gramming skills but doesn’t assume you know much about CNTK or neural networks. The demo is coded using Python, the default language for machine learning, but even if you don’t know Python you should be able to follow along with- out too much difficulty. The code for the demo program is presented in its entirety in this article. The yacht hull data file used by the demo program can be found at bit.ly/2Ibsm5D, and is also available in the download that accompanies this article.
Understanding the Data
When creating a machine learning model, data prepara- tion is almost always the most time-consuming part of the project. The raw data set has 308 items and looks like:
-2.3 0.568 4.78 3.99 3.17 0.125 0.11 -2.3 0.568 4.78 3.99 3.17 0.150 0.27 ...
-5.0 0.530 4.78 3.75 3.15 0.125 0.09 ...
-2.3 0.600 4.34 4.23 2.73 0.450 46.66
The file is space-delimited. The first six values are the predictor values (often called features in machine learning terminology). The last value on each line is the "residuary resistance per unit weight of displacement."
Because there’s more than one predictor variable, it’s not pos- sible to show the complete data set in a graph. But you can get a rough idea of the structure of the data by examining the graph in Figure 2. The graph plots just the prismatic coefficient predictor values and the hull resistance. You can see that the prismatic coef- ficient values, by themselves, don’t give you enough information to make an accurate prediction of hull resistance.
When working with neural networks, it’s usually necessary to nor- malize the data in order to create a good prediction model. I used
Code download available at msdn.com/magazine/0518magcode.
48 msdn magazine
Figure 1 Regression Using a CNTK Neural Network
