
Page 42 - MSDN Magazine, June 2018
P. 42
on start and end times. We send that telemetry to Application Insights with the telemetryClient.track_event method using the event name “Transformation Complete,” and we include measure- ments for records transformed and transformation duration.
We add some very basic exception handling into our notebooks purely to illustrate tracking exceptions with Application Insights, as well. Note within the except block in Figure 6 that if we catch an exception, we’re going to call the track_exception method. We pass
the exception as the first parameter and the subsequent parame- ters are the same types as in track_event, allowing you to record as much information around the event as possible. One important note to make here is that there’s currently no exception-handling semantics for inline sql. So, it might be best to skip magics like %sql for production jobs until support for exception handling is added.
The other steps in our data-engineering job, including opera- tions for Acquisition and Persistence, follow the pattern seen in the Transformation code for sending telemetry events with custom mea- surements to Application Insights.
Configuring Analytics
and Alerts
With the code in place to send the telemetry, we turn to configuring Application Insights to create live dashboards, look through event and correlated event details, and set up alerts to inform and possibly take action based on the event trigger.
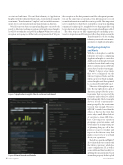
Figure 7 depicts a few charts that we’ve configured via the Metrics Explorer blade and the Metrics (preview) blade in Appli- cation Insights and then pinned to our Azure Portal Dashboard.
Take note of the right two quar- tiles. The top right shows a grid of durations grouped by the opera- tion name that we reported the telemetry under when we added the tracking calls. The bottom right shows a record count measure- ment grouped by the event name we used. Sure enough, “Persist to SQL DB” is much lower than the others, as this was the event that wrote only a small, filtered subset of our data to Azure SQL Data- base. Choosing your operation groupings, operation names, and event names is an important part of planning that pays off at this point as you get to visualize and report on the data in a way that makes sense for how you think about your operations.
The left two quartiles in Figure 7 show charts that were created with the Metrics (preview), which has a nice configuration UI, as well as some additional functionality for splitting the measurements based on another property. In the top left
Azure Databricks
Figure 7 Application Insights Charts on Azure Dashboard
Figure 8 Event Search and Details 36 msdn magazine
