
Page 48 - MSDN Magazine, May 2018
P. 48
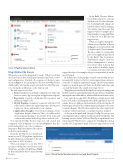
Figure 3 Pipeline View on Azure
Magic Behind the Scenes
Obviously, none of this happened by magic. When you clicked the Done button after selecting the runtime framework, service and configuration, it kicked off a sequence of distinct stages, shown in Figure 3. You can navigate to the shown DevOps Project dashboard by selecting the new project in the list of DevOps proj- ects or using the notifications on the Azure portal.
The four stages involved are:
1. Azure resources: Created and configured your Azure App
Service resources, App Service plan, and application endpoint. 2. Repository: Created a distributed Git repository and
checked in sample code.
3. CI/CD Pipeline: Seamlessly connected with the VSTS
collaboration solution for engineering teams, allowing you
to plan, test, release and monitor your solutions.
4. Application Insights: Created and configured your Application Insights telemetry. This tool enables active monitoring and learning to proactively detect issues and
continuously analyze and test hypotheses without code. Note that the DevOps Project stages not only created and configured a CI/CD Pipeline (see section 3 in Figure 3), they also
In the Build, CI runs a Maven- based build whenever someone checks in code. To reduce the num- ber of running builds, changes are batched when a build is running. You can fine-tune the events that trigger a build, for example speci- fying branches or using path filters to reduce the set of files that can trigger action.
When you explore the JaSpWe- ADemo project Pipeline, as shown in Figure 5, you’re presented with (1) Artifacts and (2) Environments. The Drop artifact is a deployable part of your application produced by the Build. The Continuous deployment trigger instructs Release Management to create a new release when it detects that a new artifact is available. Again, you can fine-tune the events that
trigger the release, for example only processing artifacts from the master branch.
By default, the CI/CD pipeline created by the DevOps Project automatically deploys to the Dev environment when a release is created by a continuous deployment trigger. The Dev environment requires no manual approval, Gates are disabled, and it has only one task that deploys the sample Azure App Service.
The pipeline generated by the DevOps Project is a great starting point for demonstrations and experimentation. For production, the pipeline may require some additional love, which we’ll discuss in the next section.
Last, open the second dNCoWe4DDemo sample project and have a look at the CI/CD pipeline. Overall the pipeline looks very similar. However, drill into the build and you’ll notice that the CI build triggers a build of the container image, pushing it to the Azure Container Registry. The CD release deploys the Azure App Service on Linux, without any Linux or container expertise required.
As shown in this quick walk-through, DevOps Projects get you started quickly with a complete and functional CI/CD pipeline. The learning curve for Azure, VSTS and DevOps is significantly lower when using DevOps Projects, compared to building the solution and the CI/CD pipeline by hand. You’re now empowered to work
performed a pull of your Code, a continuous integration Build and deployed the release to the Dev environment.
From the DevOps Project dashboard, monitor your CI/CD pipelines, Application Insights telemetry, and navigate to the rele- vant Azure or VSTS resources.
When you navigate to your new VSTS account, you’ll find two new Projects: JaSp- WeADemo and dNCoWe4DDemo (Figure 4). These are linked to the two Azure DevOps Projects.
44 msdn magazine
Figure 4 Visual Studio Team Services Account and Team Projects
Visual Studio Team Services
