
Page 37 - MSDN Magazine, April 2018
P. 37
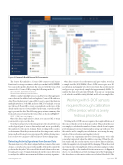
Figure 6 Cosmos DB with Sensor Kit Documents
The Sensor Kit includes a Cosmos DB connector and Azure Functions for storage containers, which you can find at bit.ly/2GEB5Mk. You can easily update data from the sensors with the Sensor Kit connected to Cosmos DB by using the following method:
await SensorKit.AzureConnectorInstance. InsertUserSensorDataAsync(userSensorData);
Athletes can have multiple sensors, and the Sensor Kit aggregates sensor data at the athlete level and updates Cosmos DB with new data. Once the data is in Cosmos DB, it’s easy to query that data via multiple interfaces, both SQL and non-SQL. For example, you can use Microsoft Power BI to create a specialized coach’s view of the data from the sensors of every athlete on the team, or use the mobile app to present the data. This following query returns summary data from each sensor found via the Sensor Kit, as shown in Figure 7:
SELECT * FROM Items.sensorSummary c
Once the data is uploaded to Azure, you can use ML to train your models or process the data.
Now that you know how the data gets into the cloud, let’s focus on the logical part of sensor data analysis and, more specifically, the analysis for the sports domain. From working with coaches, we determined that they’re interested in detecting events, such as turns, and load from g-forces experienced by athletes during runs. Let’s see how we can parse collected data to detect skiing turns.
Detecting Activity Signatures from Sensor Data
The main trajectory of the skier is aligned with movement of his center of mass, so we placed a sensor in the middle of the pelvis, inside the pocket in the ski jacket. We received data from both an accelerome- ter and a gyroscope. Using information from the sensor allowed us to analyze the athlete’s movement and define an activity signature.
Our data consists of accelerometer and gyro values stored in a sample text file (bit.ly/2GJkk2w). Our 9-DOF sensors give us a 3D acceleration and angular velocity vectors from the accelerometer and gyroscope, respectively, sampled at approximately 100Hz. To analyze the data we load it into RStudio. You can use our parsing code, which is available at bit.ly/2GLc5mG, and load our sample files.
Working with 9-DOF sensors requires thorough calibration of the sensor, which is a very tedious procedure.
Working with 9-DOF sensors requires thorough calibration of the sensor, which is a very tedious procedure. Our goal in this case was simply to calculate the number of turns, which doesn’t require performing a precise movement analysis along a specific axis. For this article, and to simplify our calculations, we’re using the mag- nitude of the acceleration and angular velocity.
Because our experiment involves detecting turns, we’re only somewhat interested when the athlete is moving. When the ath- lete stands still, the accelerometer sensor shows almost a flat line, while the angular velocity might still be changing. When the actual movement starts, the amplitude of the acceleration and gyro values changes rapidly, so the standard deviation increases. As Figure 8 shows, we can define an activity starting point at the beginning of the data where accelerometer values exceed a fixed threshold. The
msdnmagazine.com
April 2018 31
