
Page 63 - MSDN Magazine, February 2018
P. 63
C#, but you shouldn’t have too much trouble refactoring the code to another language, such as Visual Basic or Python, if you wish. The code for the demo program is presented in its entirety in this article, and is also available in the accompanying file download.
Understanding the Beta Distribution
Thompson sampling for a Bernoulli bandit problem depends on the beta distribution. In order to understand the beta distribution you must understand probability distributions in general. There are many types of probability distributions, each of which has vari- ations that depend on one or two parameters.
You may be familiar with the uniform distribution, which has two parameters, called min and max, or sometimes just a and b.
Figure 1 Thompson Sampling Demo msdnmagazine.com
A uniform distribution with min = 0.0 and max = 1.0 will return a p-value between 0.0 and 1.0 where each value is equally likely. Therefore, if you sampled 1,000 times from the uniform distribu- tion, you’d expect to get about 100 p-values between 0.00 and 0.10, about 100 p-values between 0.10 and 0.20, and so on, to about 100 p-values between 0.90 and 1.00. If you graphed the results, you’d see a bar chart with 10 bars, all about the same height.
There are many types of probability distributions, each of which has variations that depend on one or two parameters.
You might also be familiar with the normal (also called Gaussian) distribution. The normal distribution is also characterized by two parameters, the mean and the standard deviation. If you sampled 1,000 times from the normal distribution with mean = 0.0 and standard deviation = 1.0, you’d expect to get about 380 z-values between -0.5 and +0.5; about 240 z-values between +0.5 and +1.5 (and also between -0.5 and -1.5); about 60 z-values between +1.5 and +2.5 (and also between -1.5 and -2.5); and 10 z-values greater than +2.5 (and 10 less than -2.5). If you graphed the results you’d see a bell-shaped bar chart.
The beta distribution is characterized by two parameters, usually called alpha and beta, or sometimes just a and b. Note the possible confusion between “beta” representing the entire distribution, and “beta,” representing the second of the two distribution parameters.
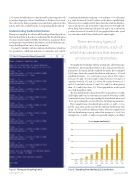
If you sample from a beta distribution with a = 1 and b = 1, you get the exact same results as from the uniform distribution with mean = 0.5. If a and b have different values, when you sample from the beta distribution you get p-values that average to a / (a+b). For example, if a = 3 and b = 1, and you repeatedly sample, you will get
3000 2500 2000 1500 1000
500 0.0
10,000 Samples from Beta(3,1)
0.00 - 0.01
0.01 - 0.02
0.02 - 0.03
0.03 - 0.04
0.04 - 0.05
0.05 - 0.06
0.06 - 0.07
0.07 - 0.08
0.08 - 0.09
0.09 - 1.00
p-value
Figure 2 Sampling from the Beta(3,1) Distribution
February 2018 59
count
