
Page 58 - MSDN Magazine, December 15, 2017
P. 58
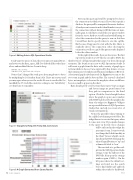
Figure 6 Editing Data in SQL Operations Studio
I only want two pieces of data, the rowcount, now named Rows, and a twist on the data_space_MB. I’ve deleted all the other lines above and modified the two I want to keep:
SUM(PART.rows) AS Rows, (SUM(ALOC.total_pages)*8/1.024) AS Bytes
Notice that I changed the total space from megabytes to bytes by multiplying by 1.024 rather than 1,024. I have my reasons and you may agree when you see the results. Be sure to save the file. I’ve modified the VS Code files.AutoSave setting to save “AfterDelay” so I don’t have to remember.
Now run the query and you’ll be prompted to choose the connection on which to run it. If you don’t specify a database, the query will be run against the master database. A handy recent connections list should make it easy to set the connection without having to fill the form out man- ually again. I could have created the new query window from the server, database or table and avoided having to select the connection for the query to run on, but then I would have had to specify where to save the .sql file. But because I happened to start with the file, I have to explicitly choose the connection. After selecting the connection, you’ll see a grid of the query results displayed below the editor window.
To the right of the results, there are four icons. The first exports the results to a CSV file, the second to JSON, the third to Excel—all functionality that came over from the mssql extension. The fourth icon is new to SQL Operations Studio. It will create a graph from the data, with a variety of graph types to from which to choose. I was surprised by this feature—it’s one that’s reminiscent of sophisticated business intelligence (BI) tools. A horizontal graph suited my needs. In Figure 8, you can see the row count in pink and the bytes in blue. The reason I calculated bytes, not megabytes, is because the megabyte values would have
been too small to appear on the chart.
That’s already pretty cool, but wait, there’s more! Copy as image
and Save as image are great features, but they pale in comparison to the third option. Click the Create Insight button above the graph to open a new window with JSON that describes the graph in the form of a widget (see Figure 9). Widgets are a powerful feature of SQL Operations Studio that can help you create a lot of visual customizations.
Notice the queryfile value pointing to the .sql file I saved in my project folder. The widget knows to execute that query when it comes into view. If you make changes to the query in the file, those changes
will be reflected in the widget the next time it’s run. I want to tweak two things that I didn’t modify in the Chart Viewer, which I can do directly in the JSON. I’ll change the value of legendPosition to “top” and columnsAsLabels to “true.”
The next task is to get this wid- get into the SQL Operation Studio settings. Copy the full text of the JSON file, then open the settings window again (CMD+,). On the left pane where the default set- tings are listed, use the search box to find “dashboard” and look within the results for dashboard.
Data
Figure 7 Snippets to Help with Tricky SQL Commands
Figure 8 A Graph Generated from Query Results 54 msdn magazine
