
Page 34 - MSDN Magazine, December 15, 2017
P. 34
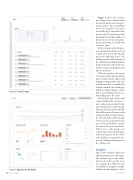
Figure 4 Crash Groups
Figure 4 shows the Crashes area of App Center. The first chart shows how many users are experi- encing crashes. The second chart shows the number of crashes received by App Center. Below the charts is a list of crash groups with the number of crashes, number of affected users, version and status. Each crash group is created with a status of open.
In the crash group details page, you can change the status to closed or ignored as you work to fix the top issues affecting users. The details page shows the stacktrace of the crash, along with distribution details of the most affected device and OS version. Individual crash reports are listed.
Click on a specific crash report to see more details. The app launch time, country, carrier, and system language setting are shown for each crash instance. If you’ve enabled the Analytics module, the details page will show all the telemetry events that occurred during the user ses- sion leading up to the crash.
You can have App Center send e-mail notifications whenever a new crash group is created. In the app settings area, you also have the option to provide a webhook URL that will be invoked for new crash groups or when new app versions are released. In the same way App Center can be connected to your repo service for build, it can also be connected to your issue tracker. When new crash groups are created, App Center will automat- ically create an issue for you. VSTS and GitHub are currently sup- ported. Additional integrations are coming soon.
Analytics
App Center analytics helps you understand your users. The single- line integration provides infor- mation about how many users are using the app. When the app is installed, it’s assigned a unique identifier used for analytics. (Don’t
App Center
Figure 5 App Center Analytics 30 msdn magazine
